> ## Documentation Index
> Fetch the complete documentation index at: https://docs.skylit.ai/llms.txt
> Use this file to discover all available pages before exploring further.
# Flowseeker field guide
> See where money is going in the options market right now, and whether it looks like a brand-new position or just noise.
Educational material, not financial advice. Nothing here is a recommendation to buy or sell any security. Options involve significant risk and are not suitable for every investor. Past behavior of any reading or setup does not guarantee future results.
Why it matters
Big options orders show you where other traders are putting real money. Flowseeker lets you watch that money as it trades.
Two words come up everywhere in this guide. A **print** is one reported trade. **Flow** is the stream of those prints. Every page answers one question: **who is putting money into which options right now, and does it look like a new position?**
You can look at flow at three levels:
| Level | What you see | Where |
| ------------ | ----------------------------------------------------------------------------------------------- | ------------------------------------------------- |
| The print | One trade: contract, where it filled against the bid and ask, size, dollars paid, open interest | Live Feed, Dark Feed (stock prints) |
| The contract | A contract's whole session: volume, dollars traded, change in open interest, bid/ask mix | Flow Scanner, Contract Lookup, Contract Drilldown |
| The market | Flow summed or ranked across names, sectors and strikes | Flow Compass |
Where to find it
Flowseeker has its own section in the left sidebar: **Live Feed, Dark Feed, Flow Scanner, Flow Compass, Contract Lookup, Company Events, Flow Tracker, Flow Alerts**. **Settings** also appears if your account has Discord or API access.
On a phone, the same pages sit in the Flowseeker bar: Live Feed, Dark Feed, Flow, Compass, Lookup, Events, Tracker, Alerts.
Flowseeker is included in the Community, Initiate and Pro plans.
The first time you open it, you are asked to sign the OPRA market-data agreement. OPRA is the body that publishes US options trades. Nothing loads until you sign, and you only sign once.
| You want | Go to |
| ----------------------------------------------- | -------------------------------------------------------------------------------------- |
| Every print, live or for a past date | Flowseeker > Live Feed (Trade Date filter for history) |
| Off-exchange stock prints | Flowseeker > Dark Feed |
| Busiest contracts of the session | Flowseeker > Flow Scanner (presets: Bullish Flow, Bearish Flow, Call Sells, Put Sells) |
| Market-wide boards, strike ladder, tide | Flowseeker > Flow Compass |
| One ticker or contract | Flowseeker > Contract Lookup, or click any row for the Contract Drilldown |
| Earnings, dividends, splits, insiders, Congress | Flowseeker > Company Events |
| Positions you are following | Flowseeker > Flow Tracker |
| Alerts | Flowseeker > Flow Alerts (delivery is set in Notifications) |
| Discord channels, summary sections, API keys | Flowseeker > Settings (accounts with Discord or API access) |
| Flow on a price chart | Atlas > Add menu: Flow, Net Premium, Flow VWAP, Dark Pool |
| Ask in plain English | Talon: see [Ask Talon](#talon) |
| API docs | docs.skylit.ai > Flowseeker > API Reference, and MCP Server (for connecting AI tools) |
Read it in 30 seconds
The readings, and the question each answers
| Reading | Question it answers |
| -------------- | --------------------------------------------------------------------------------------------------------------------------------------------------- |
| **Side** | Where did the print fill: below bid, bid, mid, ask, above ask? Ask-side leans buying, bid-side leans selling. It says nothing certain about intent. |
| **Premium** | How many dollars changed hands (price × size × 100)? |
| **Vol/OI** | Is today's volume large next to the contracts already open? Above 1 means more traded today than was open at yesterday's close. |
| **Size > OI** | Was a single print bigger than all the open interest? The strongest hint that a position is being opened, not closed. |
| **Delta OI** | Did open interest actually grow after the session? This is the confirmation, and it arrives the next morning. |
| **Flow Score** | How directional a print looks, from -100 (bearish) to +100 (bullish). A ranking aid, not a forecast. |
| **Sweep** | Was the order filled across several exchanges at once? Sweeps suggest urgency, not direction. |
| **Multi-leg** | Was the print part of a spread or combo? If so, the single leg's direction can mislead. |
| **Cross** | Were both sides matched before the print? Then its side is not a sign of aggression. |
| **NCP / NPP** | Net call premium and net put premium. Each nets aggressive buying against aggressive selling, for calls and for puts. |
**In plain English.** Every option has a bid (what buyers offer) and an ask (what sellers want). Paying the ask means someone was in a hurry to buy; hitting the bid means someone was in a hurry to sell. That is all side tells you. A hedge, a close and one leg of a spread can all print at the ask.
**In plain English.** Volume counts contracts that changed hands today. Open interest counts contracts that were still open at last night's close. If 5,000 contracts trade in a strike that had 800 open, more changed hands today than existed yesterday. That can be new positions, or the same contracts traded back and forth. The next morning's open interest (Delta OI) tells you which.
Read one print in six steps
1. **Single-leg or multi-leg?** If it has a multi-leg or cross flag, open it before you read direction. A big call buy is often one leg of a spread.
2. **Where did it fill?** Ask or above ask leans bought; bid or below bid leans sold. Mid tells you little.
3. **Size against open interest.** Size > OI or high Vol/OI on the ask side is the strongest hint of a new position. Tomorrow's Delta OI confirms or retracts it.
4. **Premium for this name.** \$500K is routine on SPY and large on a small cap.
5. **Expiry and strike.** Short-dated, out-of-the-money size is a bet on a move soon. Long-dated or in-the-money size is more often a hedge or stock replacement.
6. **Then look at the chart.** Click the row to open the contract, or open the ticker on Atlas, to see where the print sits against price and Heatseeker levels.
**Rule of thumb.** A print is a clue, not a thesis. Look for two or three clues that agree (side, size vs OI, repetition, a level) before you call it positioning.
How to use it
Not sure where to start? Many traders pick a page by trading style. Each page named here is explained further down.
| Style | Start with | Watch for |
| ----------------------------------- | ----------------------------------------------------------------------------------------- | ---------------------------------------------------------------- |
| **0DTE (expires today) / intraday** | Strike Flow on SPY and QQQ (1M to 15M windows), a Live Feed tab with DTE 0 and single-leg | Buying vs selling at the strikes nearest spot; Market Tide slope |
| **Swing** | Repetitive Hits, Large Opening Orders, Flow Tracker | New size that survives into the next day's open interest |
| **Reversal** | Heatseeker levels, Strike Flow at the level | Put selling into a floor, call selling into a ceiling |
| **Premium sellers** | Flow Scanner presets Call Sells and Put Sells | Who else is selling, and at which strikes |
| **Earnings** | Company Events, Live Feed earnings filter | Size into the report vs the stock's history; IV going in |
Live Feed
**Why it matters:** this is the tape. Every row is **one trade**, so you see big orders the moment they print.
**Where:** Flowseeker > Live Feed.
1. Check the **status pill**. LIVE means it is streaming. PAUSED means you are viewing history or paused it. CONNECTING or OFFLINE means the stream dropped.
2. Open **Filters** to narrow the tape. Good first filters are ticker, Type (calls or puts), Side, Days to Expiry and Premium. To exclude a ticker, type `!TICKER`.
* The panel also has Flow Score range, Equity Type (stocks, ETFs, indices), Trade Date, Expiry Date, Open Interest, Volume, Vol/OI Ratio, Size and % OTM.
* And more: stock, strike and contract price, Days to Earnings, IV % and IV Inflation, the contract's Ask %, Bid % and Skew %, and sector and industry.
3. Flip the quick toggles you need: Volume > OI, Size > OI, Exclude Deep ITM, OTM Only, Multi-Leg Only, Single-Leg Only, Sweeps Only, Crosses Only.
4. Open **Columns** to show, hide and reorder columns. The choices are Date/Time, Ticker, Strike, C/P, OTM, Exp, DTE, Fill, Spread, Side, Flow Score, Contract Ratio, Size, Prem, Vol, OI, ΔOI, Spot, IV, V/OI, Strategy and Earnings.
5. Turn on **Flow Highlighting** at the foot of the Columns panel. It colours rows whose volume or size is above open interest, in colours you pick. Prints big enough to be new positions then stand out while the feed scrolls.
6. Save the setup as a tab. Each **feed tab** keeps its own filters, columns, sort and highlighting. Use **Add new feed tab**, **Rename** and **Duplicate** to keep setups side by side, for example "0DTE SPY" or "Earnings week".
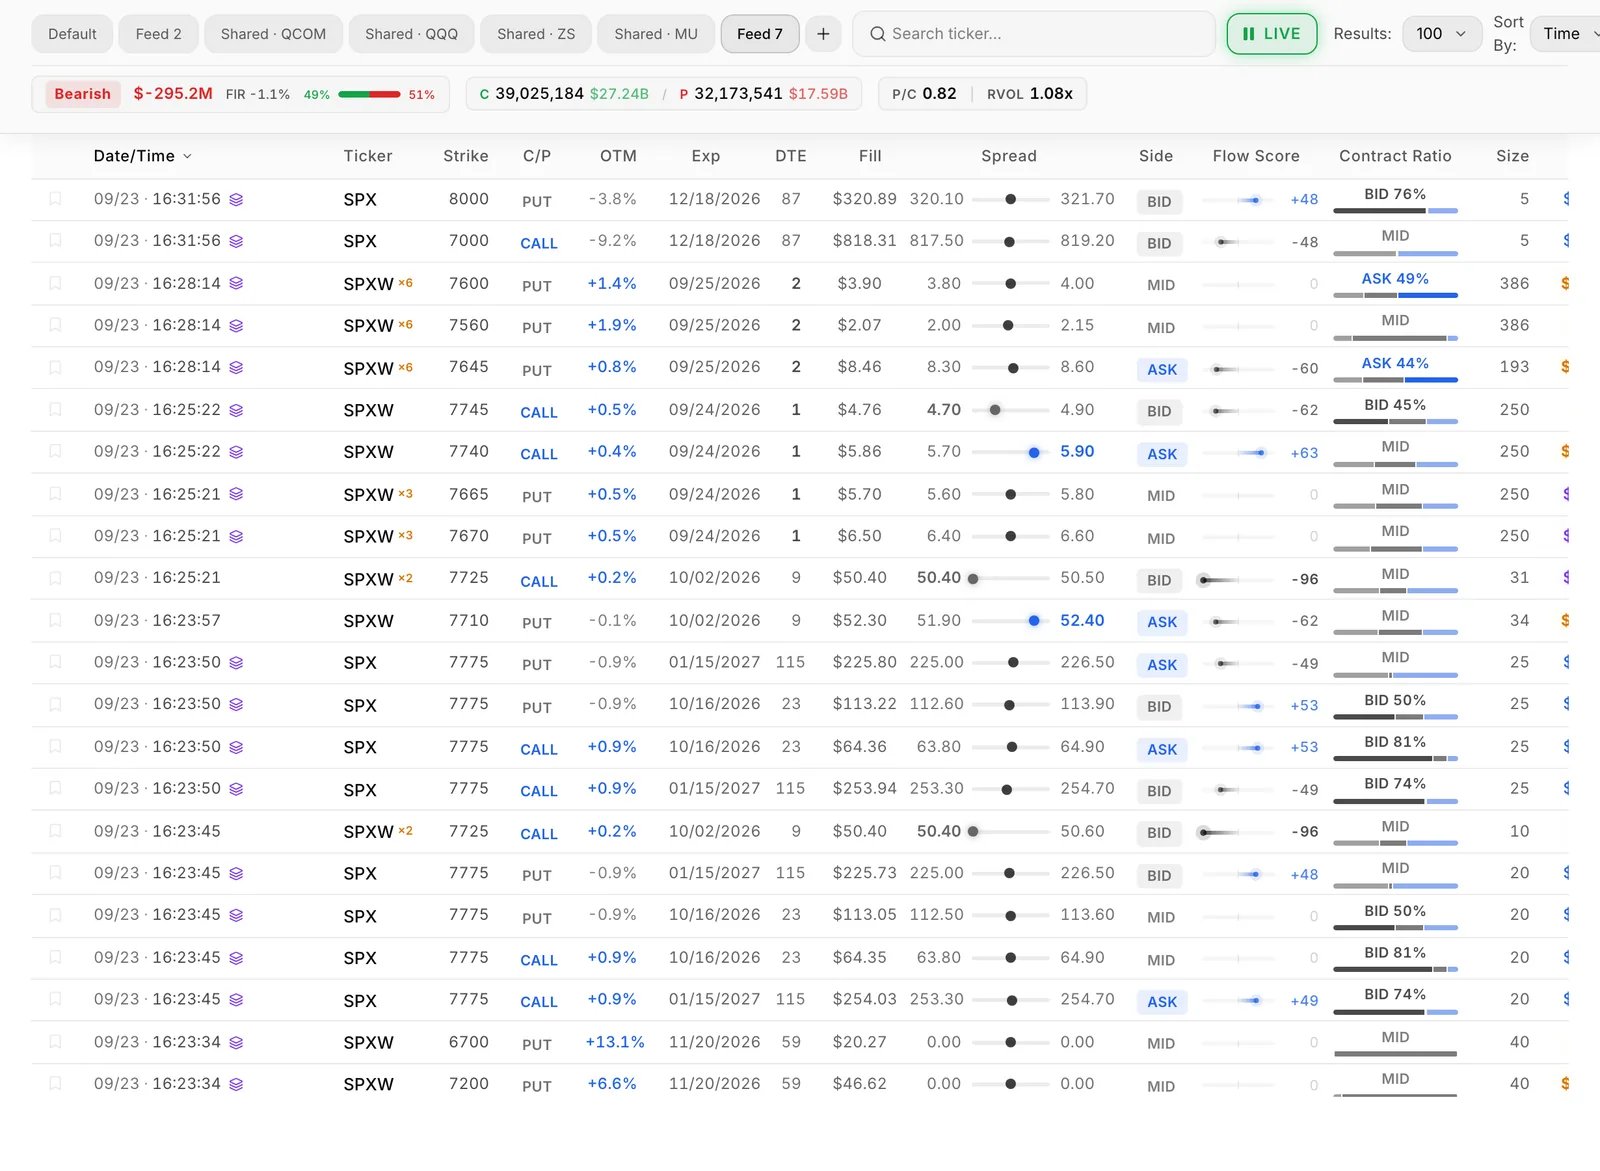
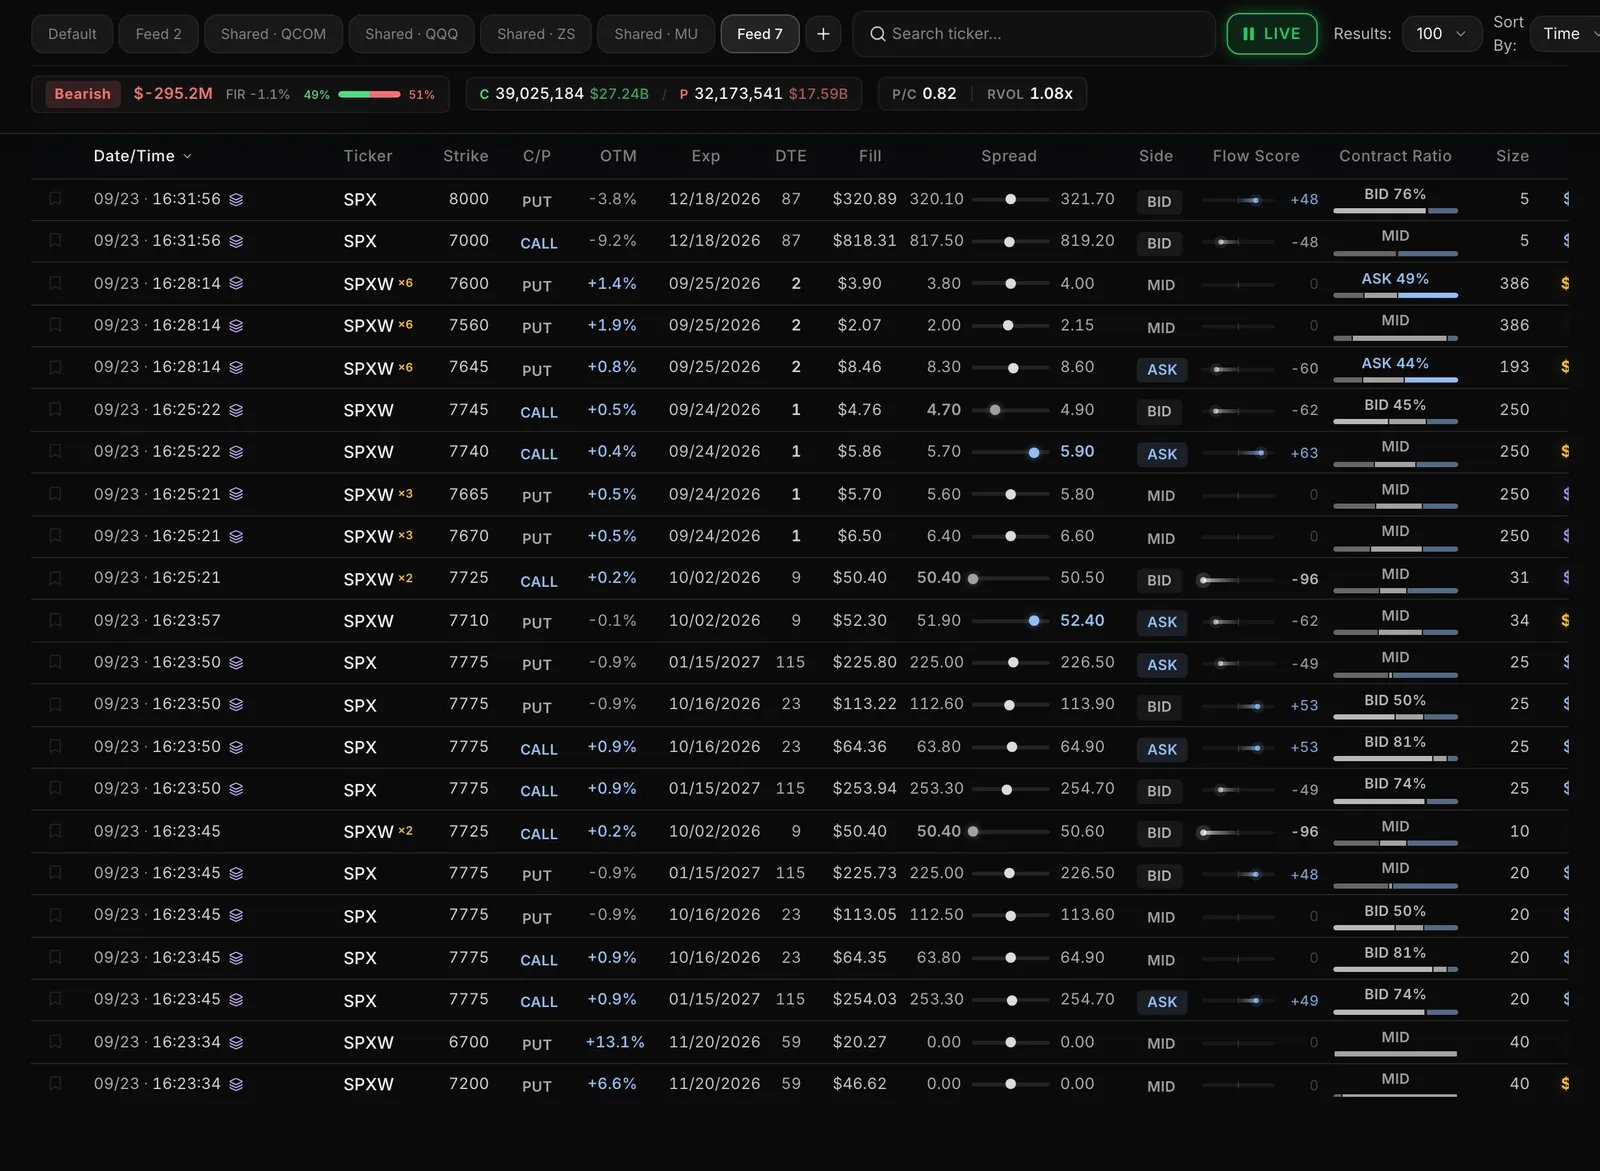 What you can do with a row:
* **Click** it to open the Contract Drilldown.
* **Right-click** it to **Track trade**, or right-click a filterable cell (such as Ticker or Side) to **Show matching** or **Filter out** that value. Accounts with Flowseeker sharing also get **Add to summary**.
* A **multi-leg** row opens a strategy view with its strike structure.
* A **cross badge** marks a cross that was paired with a stock hedge. Click it to see both legs.
* **Share** (top right) copies or saves an image of the feed, or downloads the rows as CSV.
**Empty feed?** Check the status pill and the Trade Date filter first. A tab left on a past date shows PAUSED and no new prints.
What you can do with a row:
* **Click** it to open the Contract Drilldown.
* **Right-click** it to **Track trade**, or right-click a filterable cell (such as Ticker or Side) to **Show matching** or **Filter out** that value. Accounts with Flowseeker sharing also get **Add to summary**.
* A **multi-leg** row opens a strategy view with its strike structure.
* A **cross badge** marks a cross that was paired with a stock hedge. Click it to see both legs.
* **Share** (top right) copies or saves an image of the feed, or downloads the rows as CSV.
**Empty feed?** Check the status pill and the Trade Date filter first. A tab left on a past date shows PAUSED and no new prints.
Dark Feed
**Why it matters:** large off-exchange stock trades show the prices where big blocks of shares changed hands. Many traders keep those prices on their radar.
**Where:** Flowseeker > Dark Feed.
1. Read the columns: Date / Time, Ticker, Price, Size, Notional, % AvgVol and Sector.
2. Filter by ticker, Trade Date, Notional, Size, Share Price, AvgVol (as a % of average daily volume) and Sectors. It has its own tabs and columns, like the Live Feed.
3. Look for unusually large prints and note their price.
How to read it: a dark-pool print has no side, so it is not bullish or bearish by itself. Many traders treat large prints as **levels of interest**, especially where they line up with a Heatseeker level. That is a habit, not a tested rule.
Flow Scanner
**Why it matters:** it answers "which contracts are unusually busy today?" rather than "what just printed?". Every row is **one contract**, summed over the session.
**Where:** Flowseeker > Flow Scanner.
1. Pick a preset.
* **Bullish Flow** and **Bearish Flow** find calls or puts on stocks that traded mostly at the ask, mostly single-leg. In-the-money strikes are left out.
* **Call Sells** and **Put Sells** are the versions that traded mostly at the bid. They also include ETFs, and Put Sells keeps in-the-money strikes.
2. Adjust the filters the preset filled in. Once you change one, the preset name shows "(modified)". Extra filters include Exclude 0DTE, Exclude ITM, OPEX Only, a contract skew range, Sentiment and Chain Sentiment, and OI Growth.
3. Read the columns. Most match the Live Feed (Date/Time is the last trade). The ones to learn:
* **Avg** (volume-weighted price) and **Last** price, **Chg%** and **Day%**.
* **ΔOI** and **ΔOI%**: change in open interest since the last session.
* **%Tot**: this contract's share of total market volume.
* **Bull/Bear** and **Chain Bull/Bear**: the bullish/bearish split for the contract and for the whole ticker (see the Glossary).
* **Contract Ratio**: how aggressively the contract traded, as its bid/ask mix.
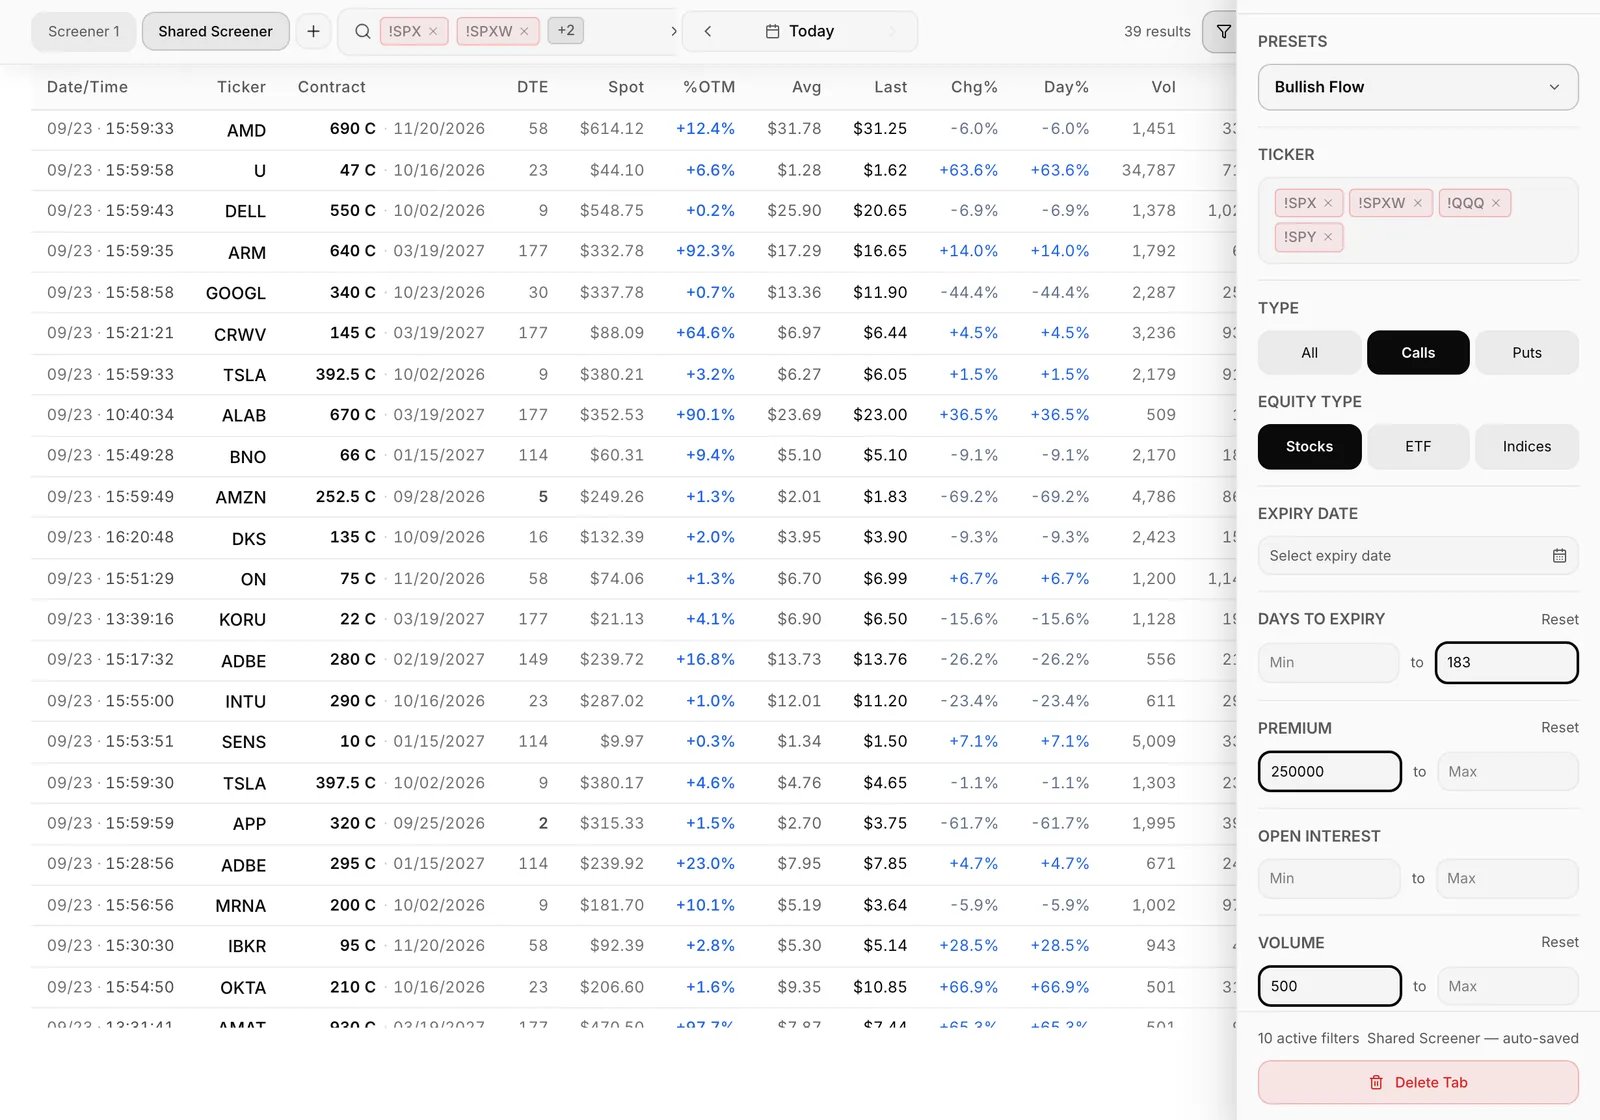
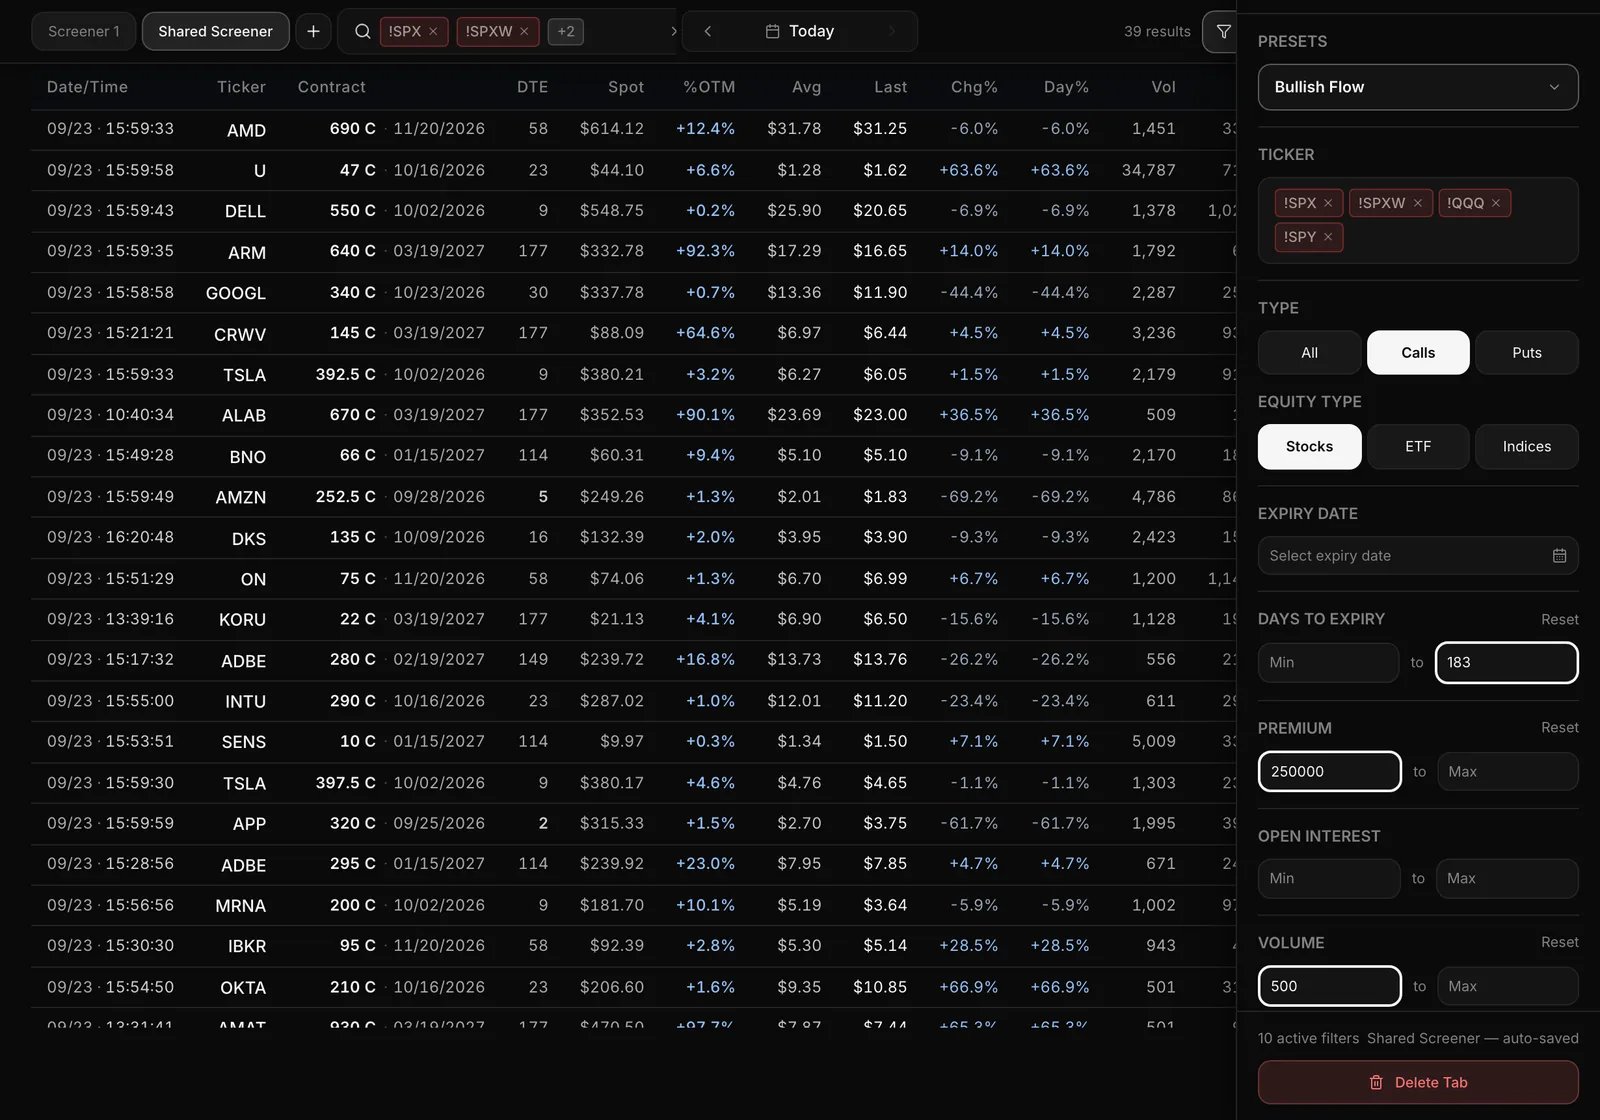 The table lists the top 100 contracts by premium and refreshes every few seconds.
Flow Compass
**Why it matters:** one board takes you from the whole market down to a single contract. You see where money is concentrating without scanning thousands of prints.
**Where:** Flowseeker > Flow Compass.
1. Start at the market cards (Market Tide, Net Impact, Top Industries) to see the day's lean.
2. Move to a ticker (Strike Flow) or to screens that surface contracts (Aggressive Bets, Repetitive Hits, Large Opening Orders).
3. Press a card's **info** button for its full definition, and hover for exact figures.
4. Drag rows and cards into your own order.
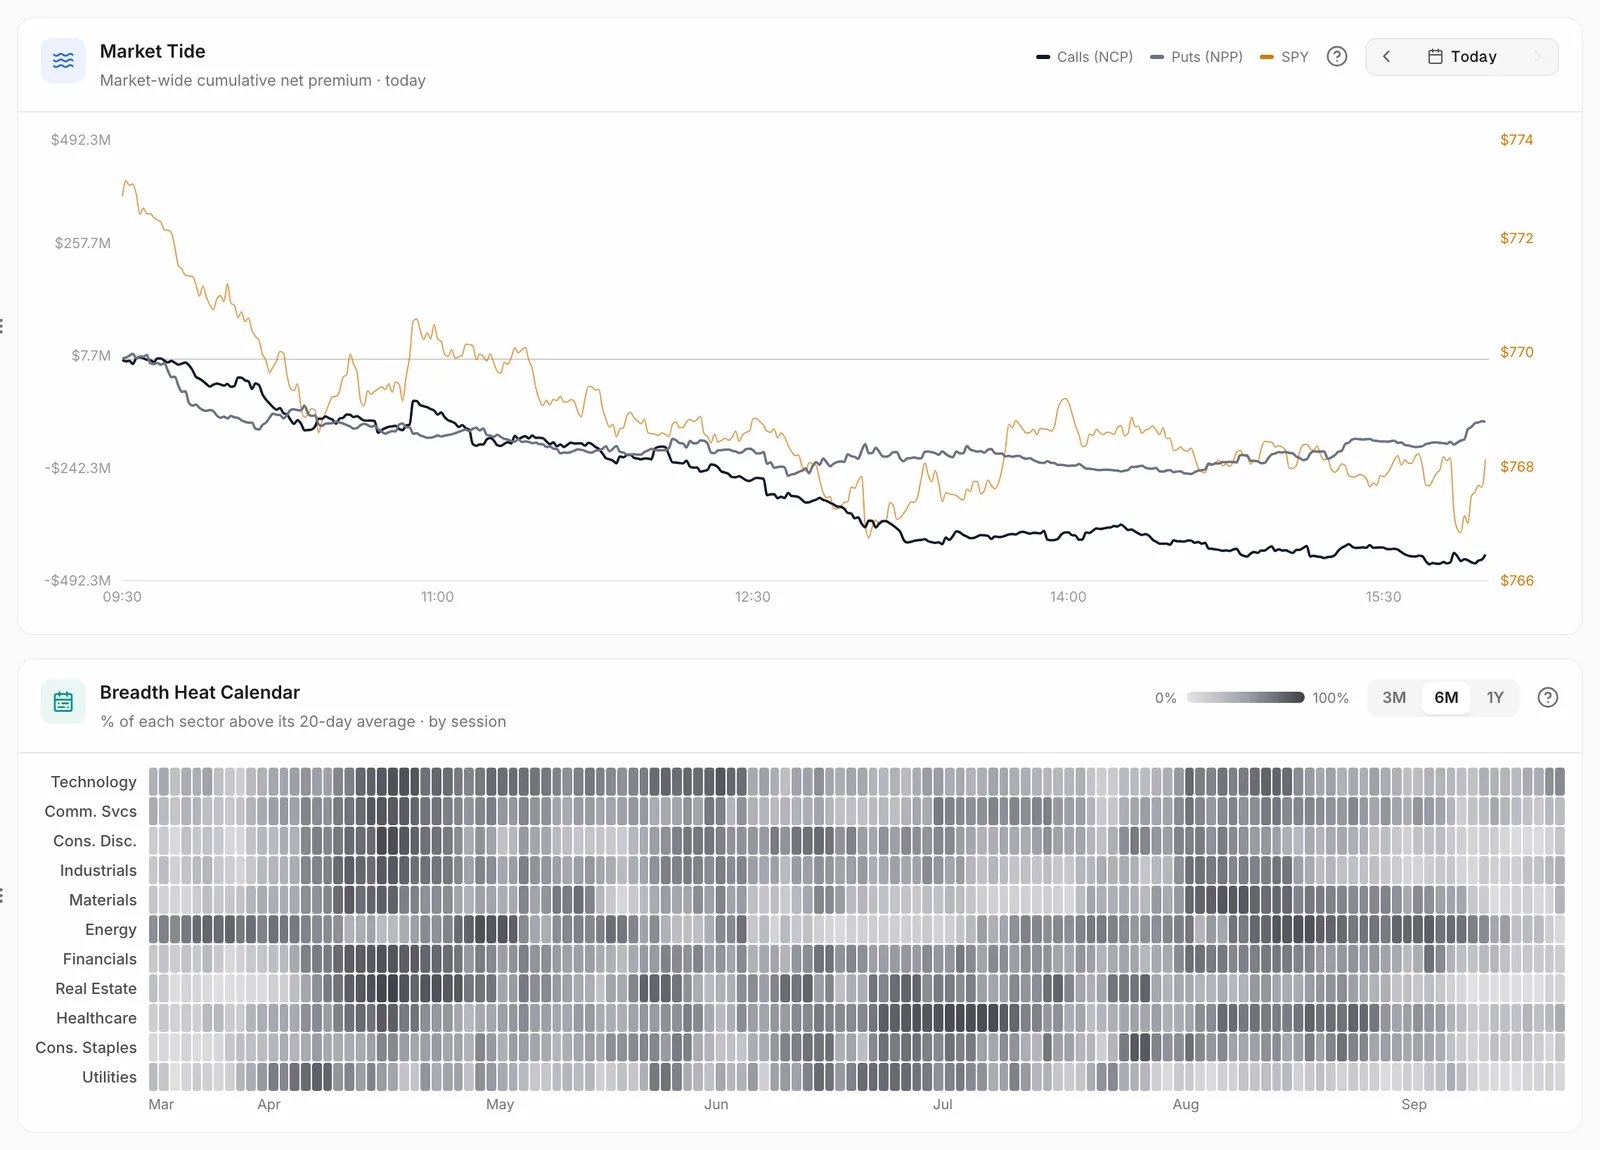
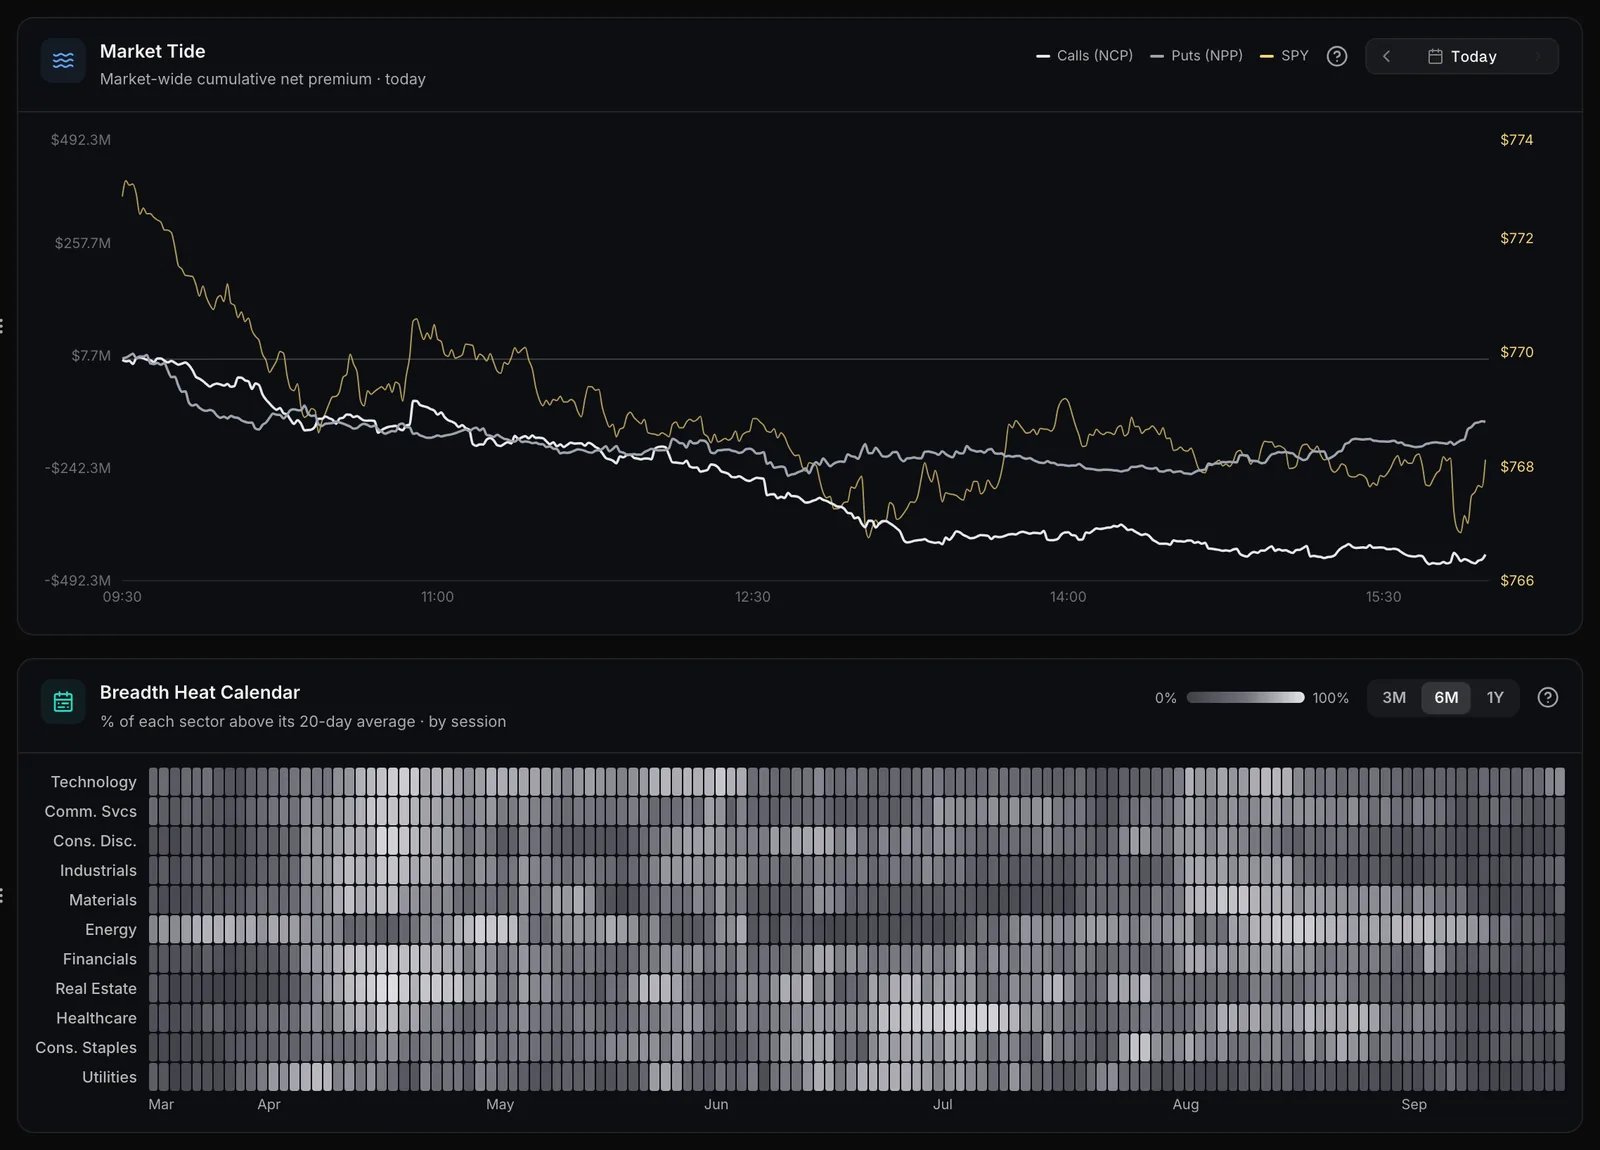 Most cards refresh about once a minute while the tab is visible and pause while it is hidden (Strike Flow's 1M and 3M windows refresh faster).
| Card | What it answers |
| ------------------------- | ------------------------------------------------------------------------------------------------------------------------------------------------------------------------------------------------------------------------------------------------------------------------------------------------------------------------------------------------------------------- |
| **Breadth Heat Calendar** | Per sector, what share of stocks closed above their own 20-day average. Broad or narrow participation. Daily; it does not move intraday. |
| **Rotation Map** | Each sector against an equal-weighted market: leading, weakening, lagging, improving. Press play to replay the rotation. |
| **Net Impact** | Today's most bullish and most bearish names by net premium (NCP minus NPP). Indices and broad ETFs are excluded. |
| **Strike Flow** | One ticker, strike by strike. Call premium is on the left, put premium on the right. Each is split into bought (above the mid) and sold (below the mid). Mid prints are left out of the bars and shown on hover. Opens on SPY, with a second card on QQQ. Windows run from 1M to DAY (it opens at 15M). REPLAY steps through an earlier session a minute at a time. |
| **Aggressive Bets** | Heavily bought, out-of-the-money, single-leg contracts whose volume is unusual for that contract. Ranked by how unusual, not by size. |
| **Top Industries** | Today's premium grouped by industry and ranked by net directional flow. Click an industry for its leading tickers. |
| **Repetitive Hits** | Contracts hit this week by several similar-size, ask-side bursts. The pattern can mean someone is building a position in pieces. |
| **Large Opening Orders** | Today's largest bought-to-open single-leg orders, where the order was bigger than the contract's open interest. |
| **Market Tide** | The whole market's cumulative NCP and NPP through the session, with SPY on the right axis for context. Step back through past sessions with the arrows or the calendar. |
Most cards refresh about once a minute while the tab is visible and pause while it is hidden (Strike Flow's 1M and 3M windows refresh faster).
| Card | What it answers |
| ------------------------- | ------------------------------------------------------------------------------------------------------------------------------------------------------------------------------------------------------------------------------------------------------------------------------------------------------------------------------------------------------------------- |
| **Breadth Heat Calendar** | Per sector, what share of stocks closed above their own 20-day average. Broad or narrow participation. Daily; it does not move intraday. |
| **Rotation Map** | Each sector against an equal-weighted market: leading, weakening, lagging, improving. Press play to replay the rotation. |
| **Net Impact** | Today's most bullish and most bearish names by net premium (NCP minus NPP). Indices and broad ETFs are excluded. |
| **Strike Flow** | One ticker, strike by strike. Call premium is on the left, put premium on the right. Each is split into bought (above the mid) and sold (below the mid). Mid prints are left out of the bars and shown on hover. Opens on SPY, with a second card on QQQ. Windows run from 1M to DAY (it opens at 15M). REPLAY steps through an earlier session a minute at a time. |
| **Aggressive Bets** | Heavily bought, out-of-the-money, single-leg contracts whose volume is unusual for that contract. Ranked by how unusual, not by size. |
| **Top Industries** | Today's premium grouped by industry and ranked by net directional flow. Click an industry for its leading tickers. |
| **Repetitive Hits** | Contracts hit this week by several similar-size, ask-side bursts. The pattern can mean someone is building a position in pieces. |
| **Large Opening Orders** | Today's largest bought-to-open single-leg orders, where the order was bigger than the contract's open interest. |
| **Market Tide** | The whole market's cumulative NCP and NPP through the session, with SPY on the right axis for context. Step back through past sessions with the arrows or the calendar. |
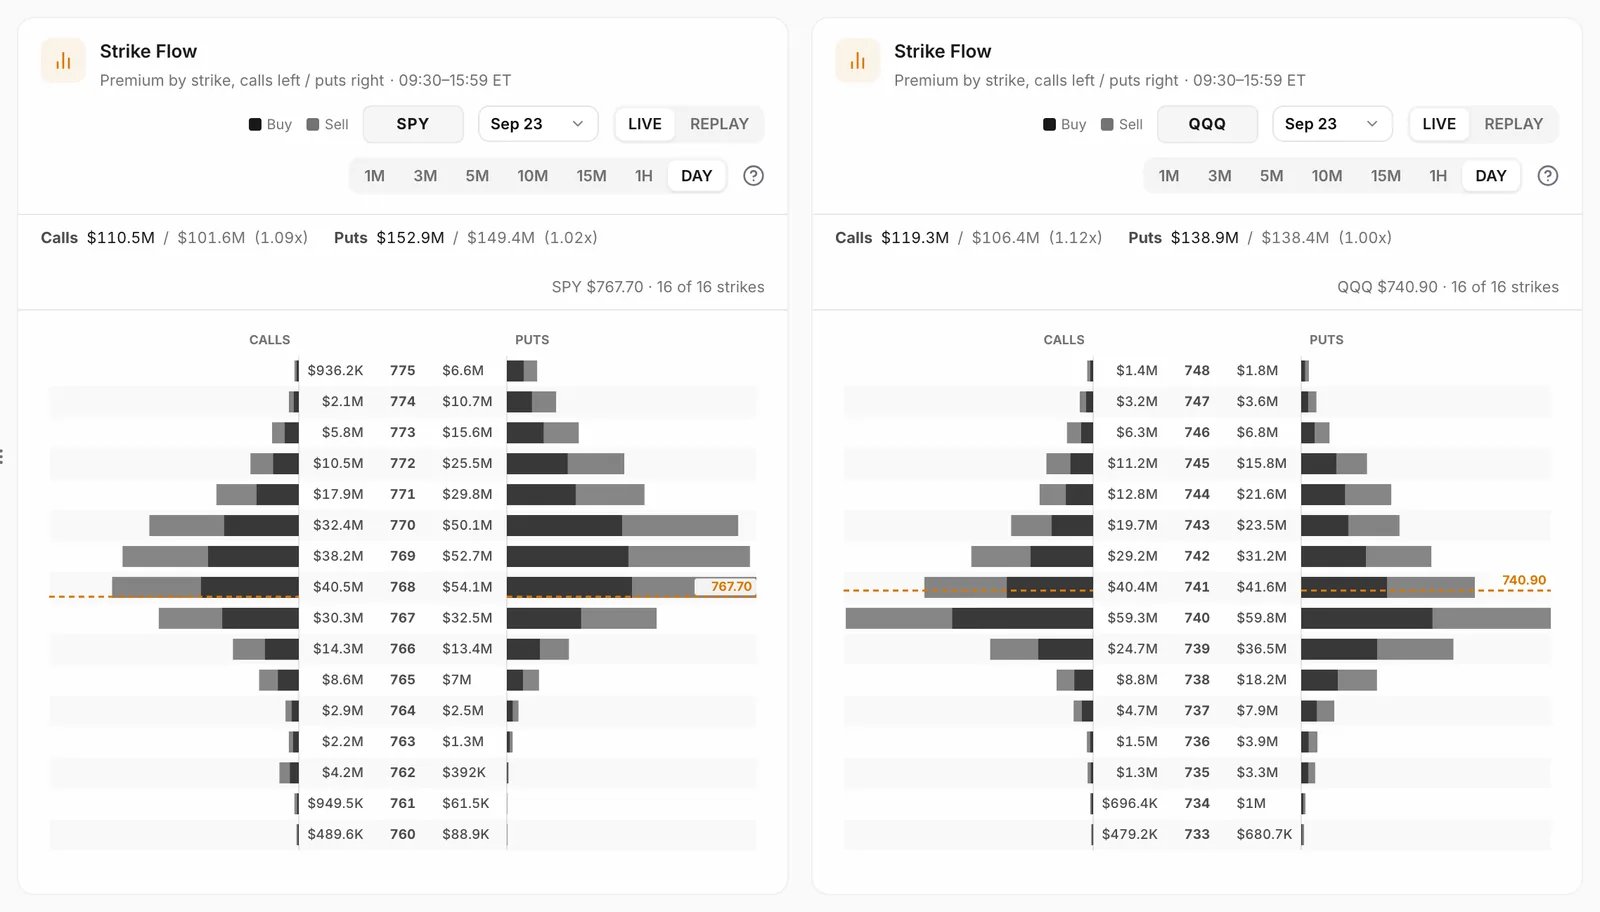
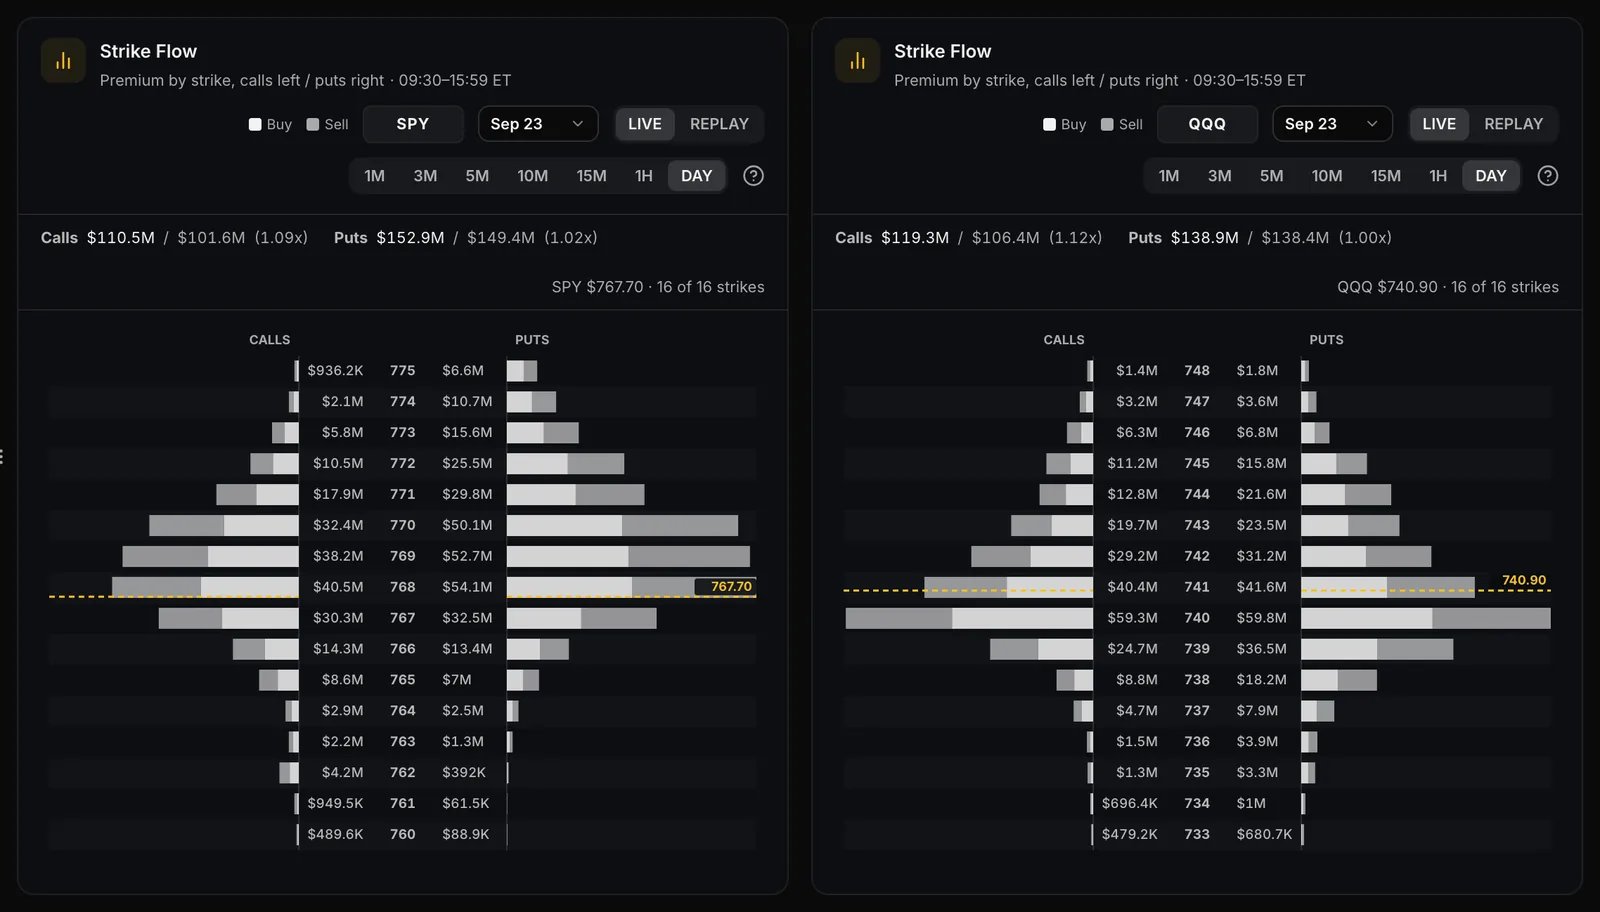 **Two things that trip people up.**
* Scope differs by card: market-wide, one industry, one ticker, one contract.
* Colours on Strike Flow are aggression, not direction. Sold calls are not the same as bought puts.
**Two things that trip people up.**
* Scope differs by card: market-wide, one industry, one ticker, one contract.
* Colours on Strike Flow are aggression, not direction. Sold calls are not the same as bought puts.
Contract Lookup and Contract Drilldown
**Why it matters:** when a name catches your eye, this shows everything traded in it in one place. You can tell one loud print from real, repeated interest.
**Where:** Flowseeker > Contract Lookup, or click any row anywhere for the Contract Drilldown.
1. Type a ticker (`TSLA`) for its overview, or a contract (`TSLA 6/20 135 C`) to go straight to it.
2. Read the overview at the top: spot price and daily move, call, put and net premium, the put/call ratio (P/C) and the bullish/bearish mix.
3. Below it are five boards: Top Volume, Top Premium, Top Open Interest, Unusual · Vol / OI and Top Sweeps. Top Sweeps ranks contracts by premium traded as sweeps, with **Swept %**, the share of the contract's volume that was swept.
4. Switch the boards between **1D**, **7D** and **1M**. Volume and premium are summed over the window; open interest and DTE come from the latest session.
5. Tick **Single-leg only** to hide contracts where multi-leg trades drive a large share of premium, so big spreads don't crowd the boards.
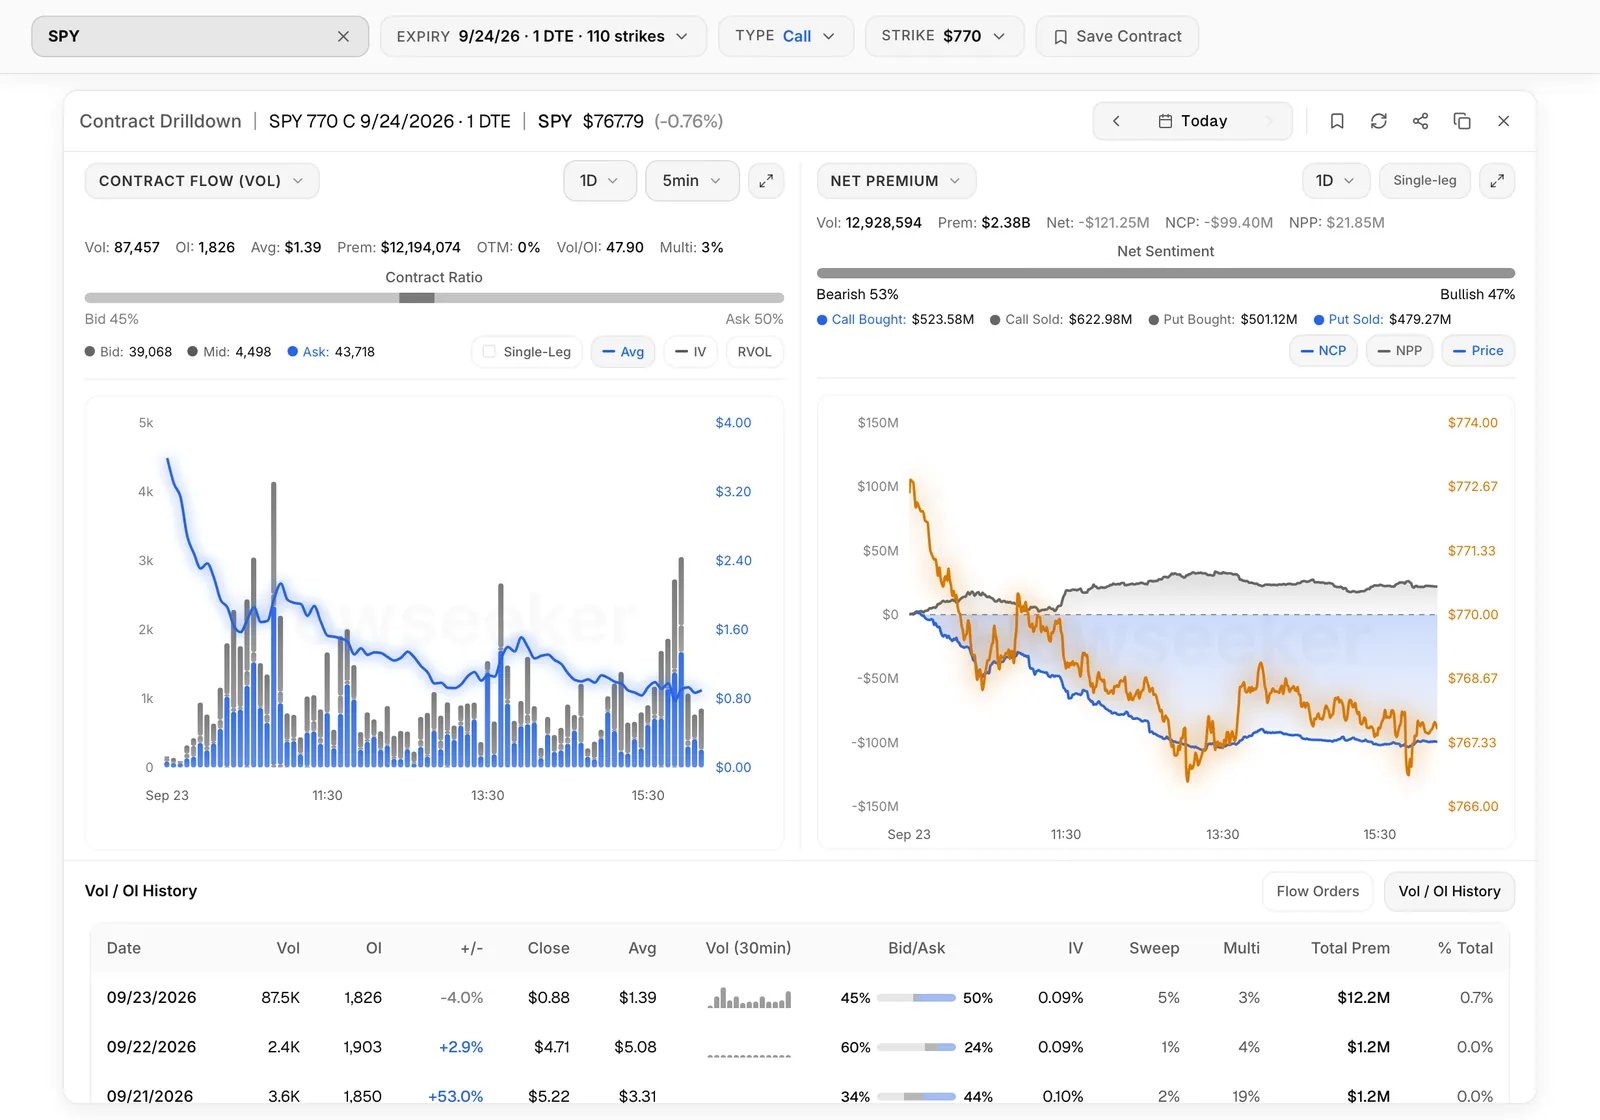
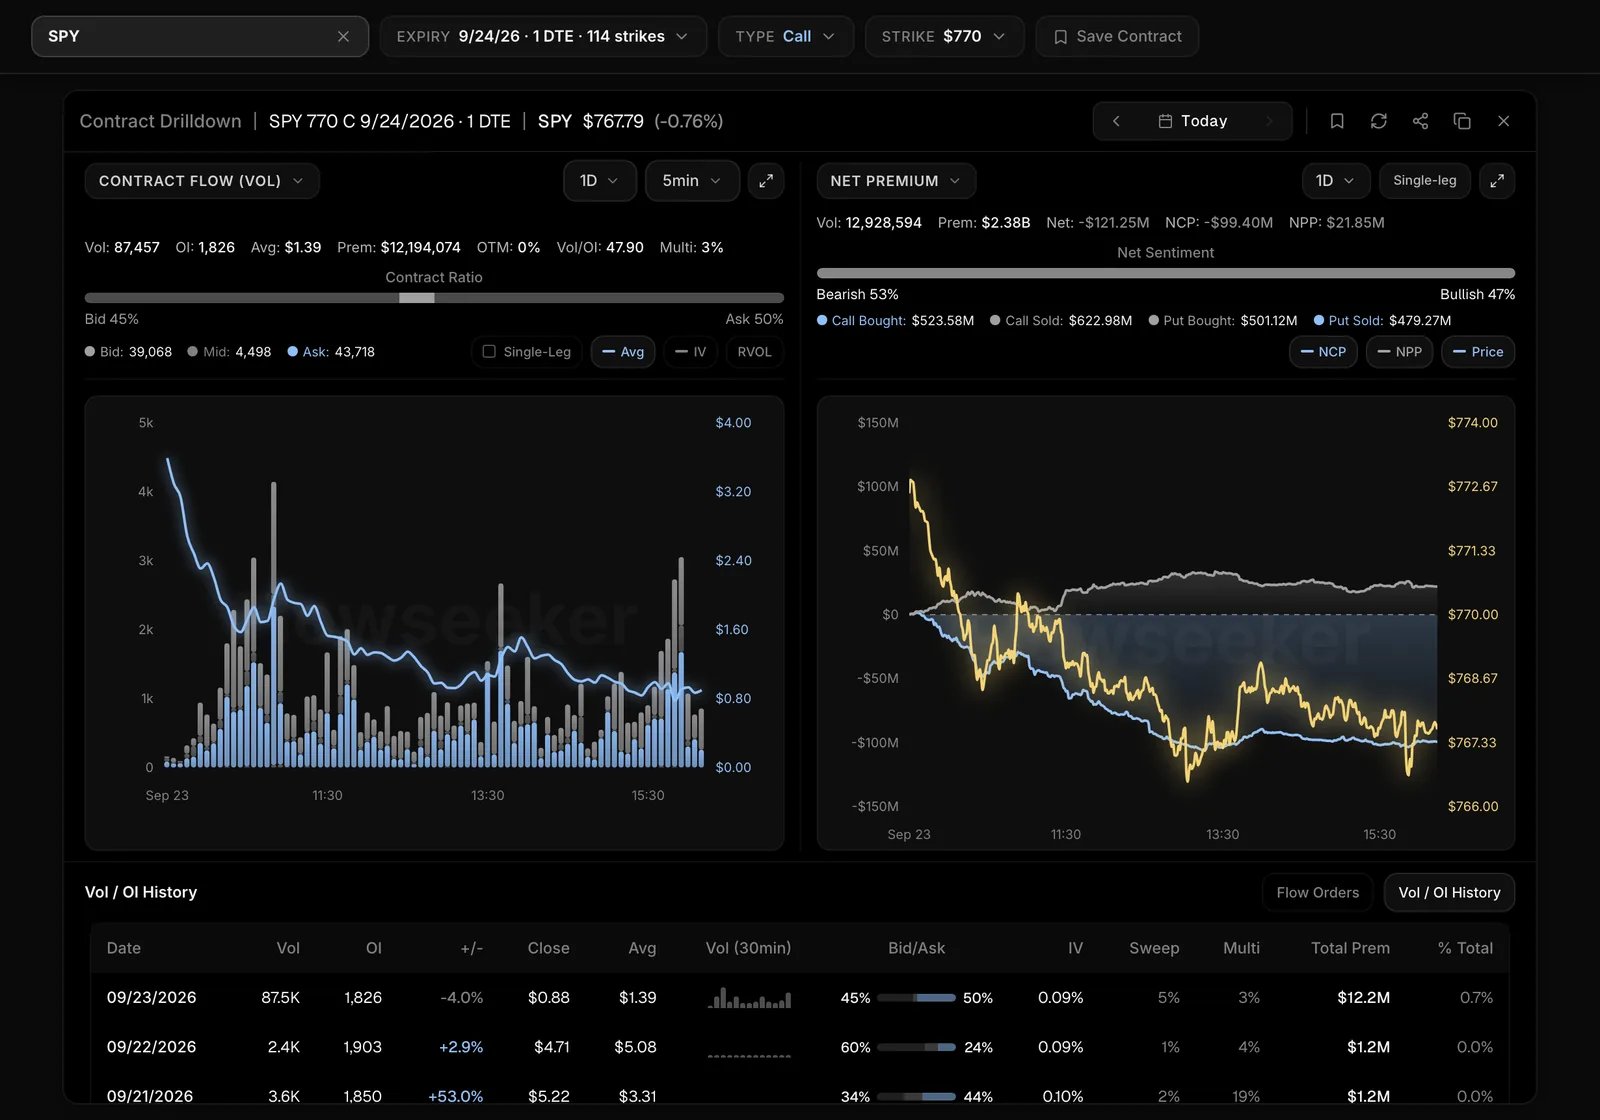
6. Open a contract for the **Contract Drilldown**. It shows:
* flow bars through the day (click a bar to see the prints behind it)
* the bid/mid/ask mix
* net premium, split into calls bought and sold and puts bought and sold
* the Flow Orders table and the contract's Vol/OI history
7. Press the **bookmark** to save the contract to the Flow Tracker.
Company Events
**Why it matters:** earnings, insider trades and Congress disclosures explain a lot of unusual flow. Check the calendar before you read size as a bet.
**Where:** Flowseeker > Company Events.
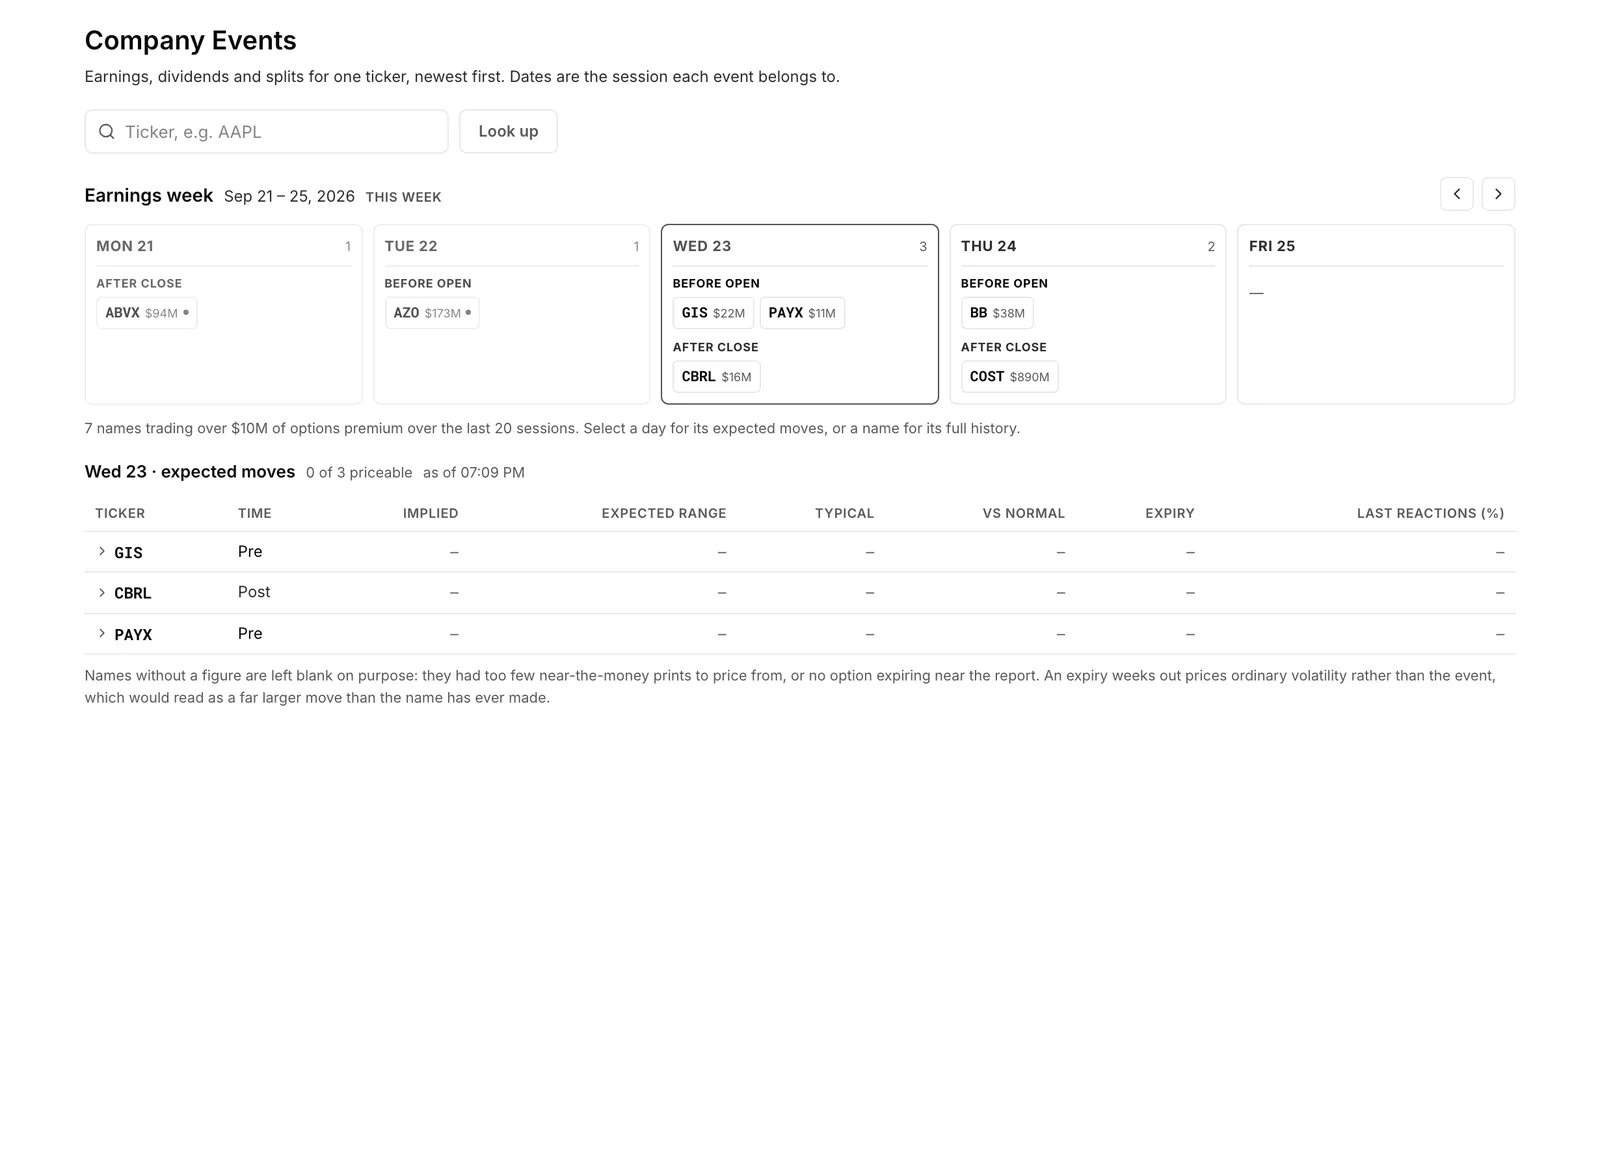
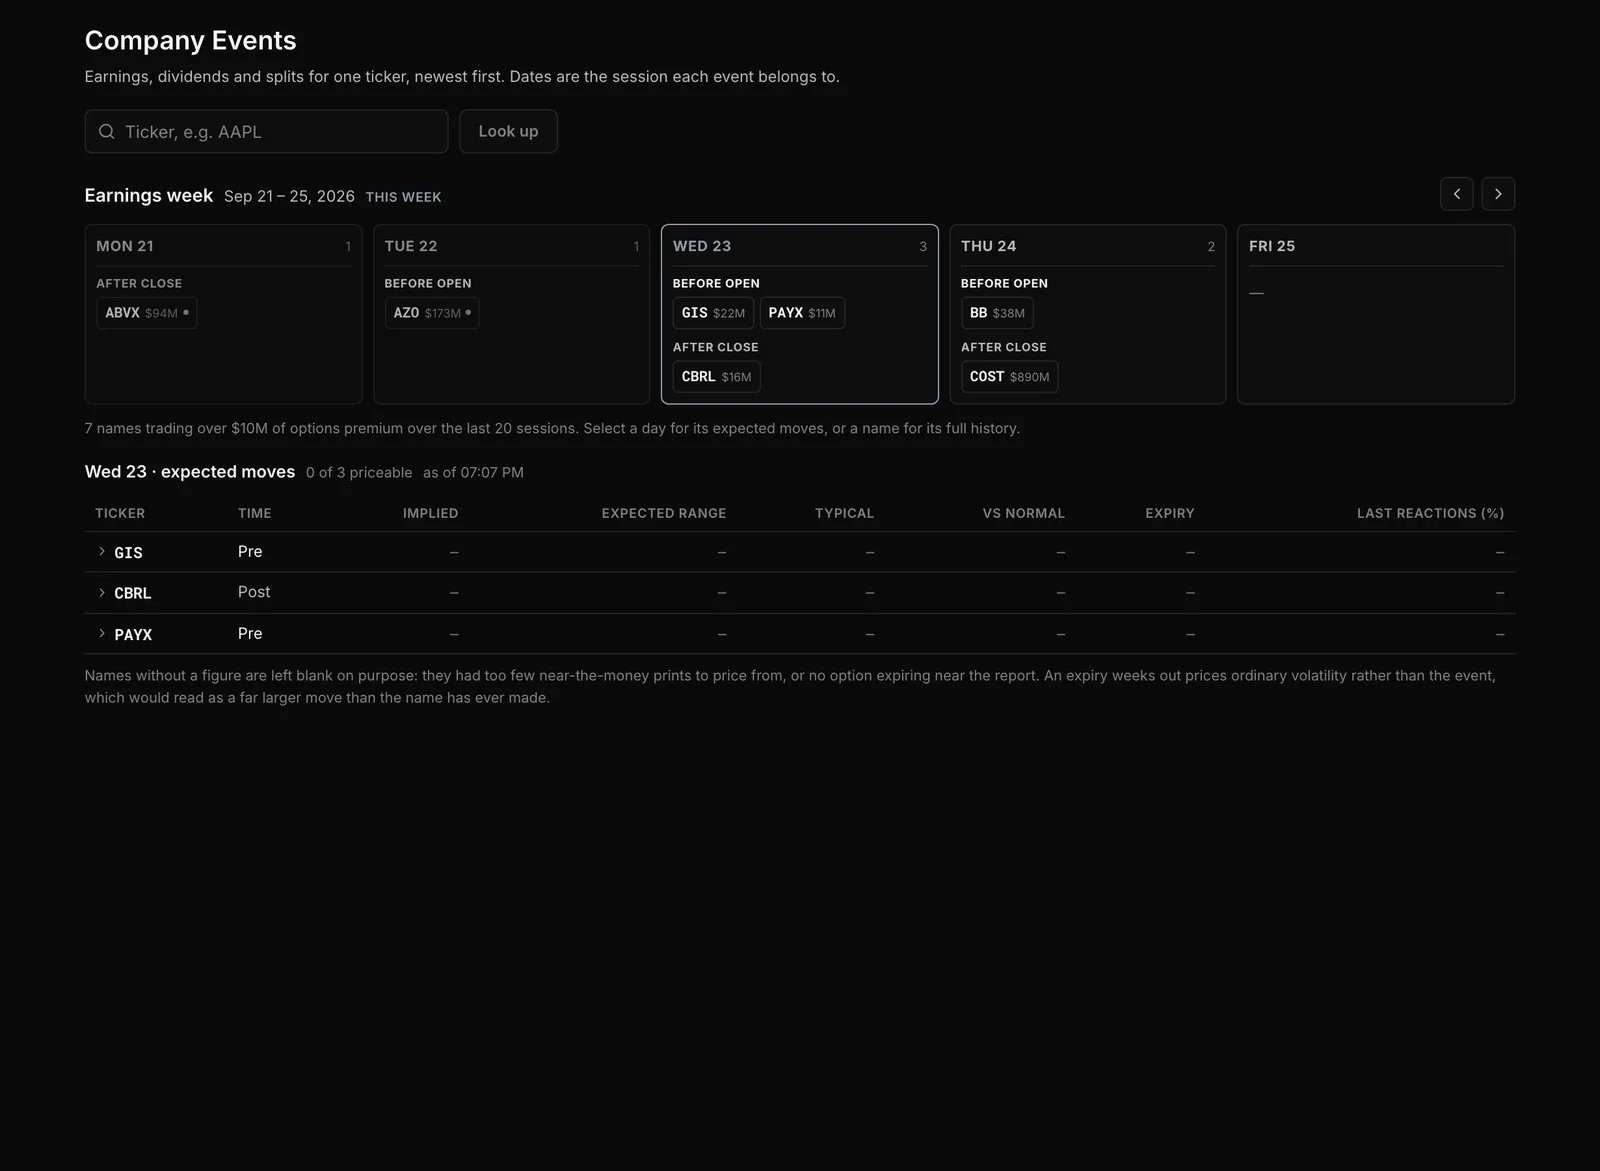
1. With no ticker entered, the page opens on this week's earnings grid: who reports each day, before or after the bell.
2. Pick a day to see its expected moves, or a name to drill into it.
3. For one ticker, read **earnings, dividends and splits**, newest first, plus **insider activity** (Form 4 filings) and **Congress** disclosures when there are any. Use the search box in the insider section to find a name, role, action or security.
 How to read it: dates marked as estimated come from a data provider, not the company. Congress disclosures are filed weeks after the trade. They give a dollar range, not a share count, so read them as slow background, not a timing tool.
Flow Tracker
**Why it matters:** a big print only matters if the trader stays in. The Tracker follows the positions you care about and tells you whether they appear to still be open.
**Where:** Flowseeker > Flow Tracker.
1. Save prints with **Track trade** (right-click a Live Feed row). They go to **Tracked Flow**.
2. Save contracts with the drilldown **bookmark** or from a Compass card. They go to **Tracked Contracts**, which shows each contract's current mid and spot.
3. In Tracked Flow, compare the saved print to the current mid and spot, its P/L, and its status:
| Status | Meaning |
| ------------ | -------------------------------------------------------------------------------------------------------------- |
| **Still in** | No significant exit detected. |
| **Pending** | A large opposite-side trade printed today; confirmed or retracted when open interest updates the next morning. |
| **Partial** | Part of the position appears closed. |
| **Exited** | Closes add up to the full size, or open interest collapsed. |
| **Expired** | The contract has expired. |
The status is inferred from the tape, not read from anyone's account.
Flow Alerts
**Why it matters:** you can't watch the tape all day. Alerts tell you when a print you care about shows up.
**Where:** Flowseeker > Flow Alerts.
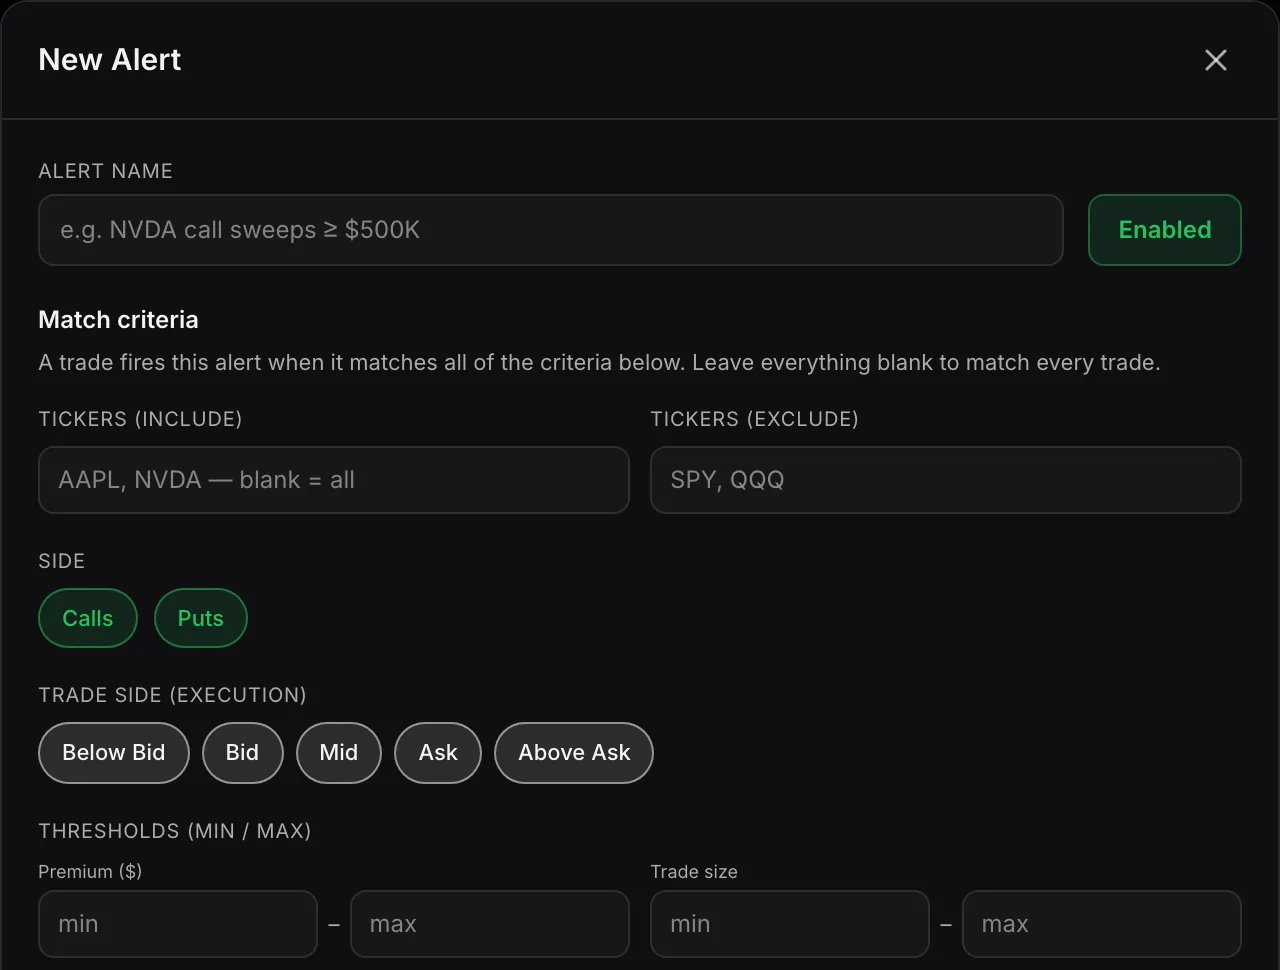
1. Press **New Alert**, give it an **Alert name** and pick the filters you want. The alert fires on each matching print as it arrives.
2. Set **Rate limit (max alerts / minute)** so a burst doesn't flood you.
3. Choose delivery (in-app, push, email, Discord DM) once, in **Notifications**.
4. Find your alerts on the **Alerts** tab. The **History** tab shows what fired.
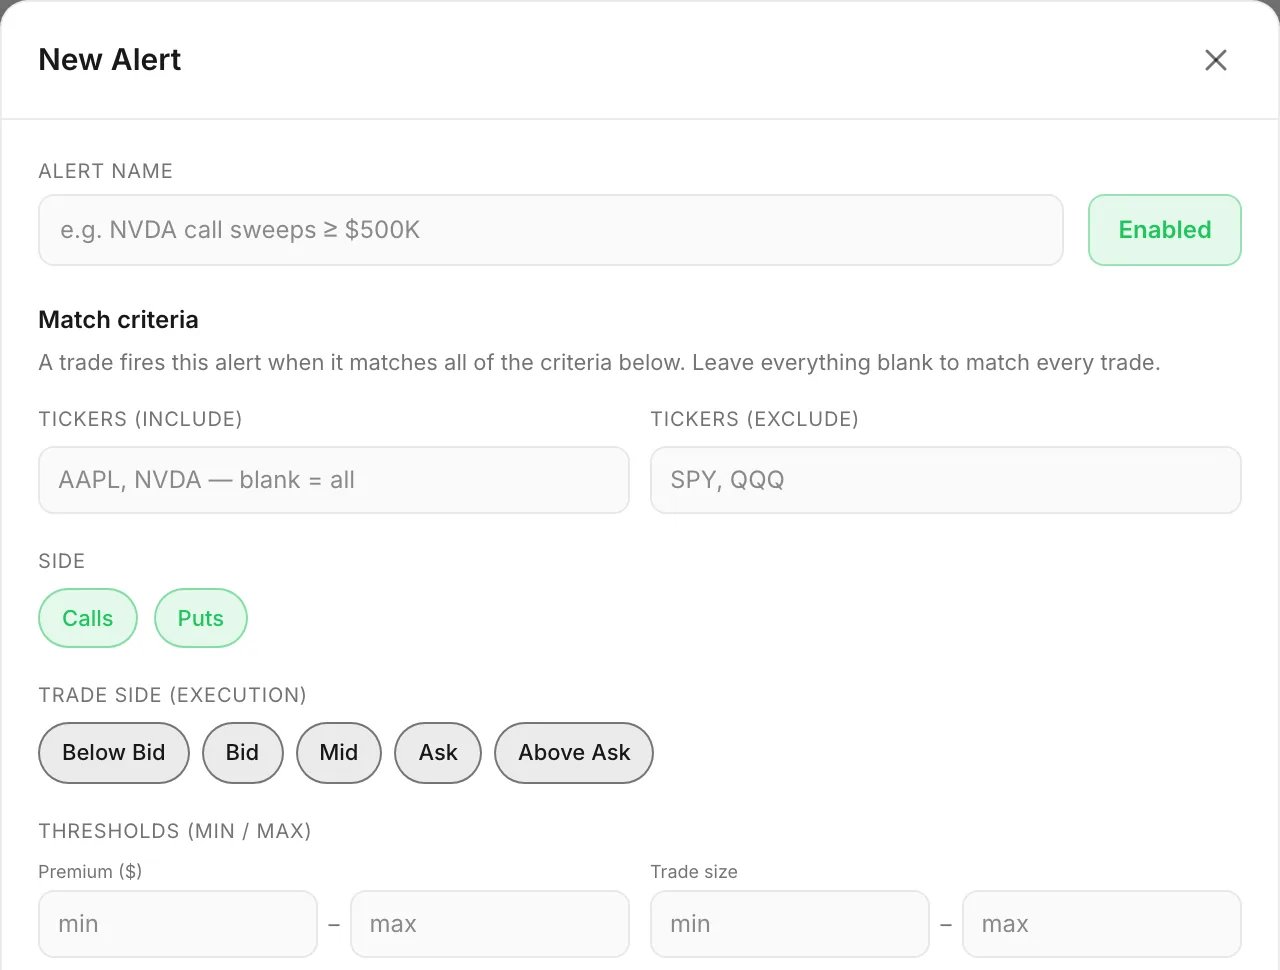
 You can keep up to 25 alerts.
Flow Summary and sharing
**Why it matters:** if you share flow with a community, this builds an end-of-day digest without copying rows by hand.
**Where:** Live Feed or Flow Scanner, on accounts with Flowseeker sharing.
1. Right-click a row and choose **Add to summary**.
2. Review the digest in the panel docked at the bottom right. It fetches current figures when you open it or press **Refresh**. A post sent after the close reports closing numbers.
3. Post it to the Discord channels you choose.
Set up Discord channels and the digest's sections under Flowseeker > Settings > Discord. Accounts with API access also get an API Keys tab there.
Use it with other Skylit tools
**Why it matters:** flow tells you what is trading. Heatseeker tells you where dealers (the market makers on the other side of options trades) are positioned. Atlas puts both on the price chart. Together they show whether money is backing a level.
The gamma terms below come from Heatseeker; its guide explains them.
| Heatseeker shows | Flowseeker shows | How many traders read it (a habit, not a tested rule) |
| -------------------------------- | ---------------------------------- | ----------------------------------------------------- |
| Positive gamma floor under price | Put selling at or near that strike | The floor looks defended. |
| Negative gamma below | Put buying and bearish Market Tide | The floor looks less protected. |
**On Atlas** (plans that include charts):
1. Open the **Add** menu and choose **Flow** for call and put premium bars under the candles.
2. Set the Flow pane's own filters:
* leg count (single, multi) and trade type (sweep, non-sweep)
* moneyness (ITM, ATM, OTM) and trade side (bid, mid, ask)
* DTE, premium and a minimum Flow Score
3. Optionally add a sweep call/put ratio line.
4. Add **Net Premium** for a pane with session-cumulative net call and net put premium.
5. Add **Flow VWAP** from the same menu.
6. Add **Dark Pool** to draw lines at the prices of the largest dark-pool prints.
Ask Talon
**Why it matters:** you can ask about flow in plain English instead of building filters.
**Where:** Talon, on Pro and higher plans (see the Talon guide, "Who can use it").
Talon knows which page you are on. On most Flowseeker pages it sees your active filters and the rows in view: Live Feed, Flow Scanner, Contract Lookup, Company Events, Flow Tracker and Flow Compass. So "what am I looking at?" is answered from your screen.
| You want | Ask Talon |
| ----------------------------- | ----------------------------------------------------------------------------------------------------------------- |
| Today's flow for a name | `/flow NVDA` · "What's the flow on AMD today?" |
| Flow at one level | "Is the 230 strike on NVDA being bought or sold?" · "What's the flow at that wall?" |
| Dark-pool prints | `/darkpool COIN` · "Any big dark pool prints on TSLA?" |
| Unusual contracts market-wide | "What's unusual today?" · "Anything lighting up?" |
| Contract boards over time | "Top premium contracts on META this month" |
| Put/call and max pain | `/metrics SPY` |
| The market | `/market` · "Where is premium going today?" |
| Earnings, insiders, Congress | `/earnings AAPL` · "Any insider buying in PLTR?" · "Which names did members of Congress trade most this quarter?" |
| This page | "Summarise this tab" · "Which of my tracked trades has the trader exited?" |
How it behaves:
* **`/flow` is single-leg.** It compares today to the last seven sessions, today included. Direction comes from the buy/sell split, never from premium alone.
* **Dark-pool reads cover the last five sessions** and cannot be widened; Talon declines longer windows.
* **Contract boards reach back about a month** (23 sessions). Volume is summed over the window. Open interest is the last session's.
* **Strike flow uses the expiry you name.** If you don't name one, Talon says which expiry it used. A strike outside the range it looked at is reported as missing, not as quiet.
* **Talon quotes what traded.** It does not tell you to take a trade.
Good to know
* **Side is where a trade filled, not why.** Ask-side leans bought and bid-side leans sold, but a hedge, a close or one leg of a spread can print on either side.
* **Much of the loudest flow is one leg of something else.** Not every spread can be detected. Check multi-leg and cross flags, and open the Contract Drilldown, before you read direction.
* **Open interest updates overnight.** During the day, Vol/OI and Size > OI compare against yesterday's close. A print can look like a new position and turn out to be a close. The next morning's Delta OI settles it.
* **Closing trades look bearish.** Bid-side size in a contract with large open interest is often someone closing, not a new bearish bet.
* **Index puts are usually protection.** SPY and QQQ put buying is routine portfolio hedging. Several Compass cards leave indices out for this reason.
* **Flow Score is a ranking, not a forecast.** It sorts prints by how directional they look. It has not been tested as a predictor of moves.
* **Flow Tracker statuses are a best guess.** They are inferred from later trades and the next morning's open interest, not read from anyone's account.
* **Stock-hedge pairings on crosses can be coincidence.** A pairing printed in the same second is solid. For pairings further apart, the badge says about one in six is coincidence.
* **Crosses Only starts on 2026-08-17.** The filter covers trades from that date onward.
* **Flow Compass cards describe today; they don't predict.** The Breadth Heat Calendar updates once a day.
* **Dark-pool prints have no side.** They are not bullish or bearish on their own.
* **Double-check some Talon answers.** For put/call and max pain, market summaries, unusual contracts, contract boards, company events, insiders and Congress, confirm Talon's answer on the matching Flowseeker page.
* **Confirm earnings dates on Company Events** before relying on Talon's.
* **Flowseeker shows what traded.** It is not a forecast and not a recommendation.
What's new
**September 2026**
* **Strike Flow bars show bought and sold only.** Strike Flow bars now show only bought and sold premium, with mid prints on hover, so each bar counts only trades with a clear side. See [Flow Compass](#flow-compass).
* **1M window on Contract Lookup.** Contract Lookup boards now switch to 1M, so you can see which contracts led volume, premium and open interest over the past month. See [Contract Lookup and Contract Drilldown](#contract-lookup-and-contract-drilldown).
* **Congress disclosures on Company Events.** Company Events now shows a ticker's trades disclosed by members of Congress, so you can spot that background before reading its flow. See [Company Events](#company-events).
* **Insider activity on Company Events.** Company Events now lists a ticker's insider filings (Form 4) with a search box, so you can check insider trades in one place. See [Company Events](#company-events).
* **Live Feed stays visible on reconnect.** Your Live Feed rows now stay on screen during a brief reconnect. The "Loading trades" overlay appears only when you change filters, sort or feed tab. See [Live Feed](#live-feed).
* **Strike Flow: 1M and 3M windows and a QQQ card.** Strike Flow adds faster 1M and 3M windows for reading strikes near spot, and a second card opens on QQQ beside SPY. See [Flow Compass](#flow-compass).
* **Flow VWAP for everyone on Atlas.** You can now add Flow VWAP on Atlas from the Add menu, next to the other flow panes, instead of the settings strip. See [Use it with other Skylit tools](#pairing-with-heatseeker-and-atlas).
* **Flow Summary digest.** With Flowseeker sharing, right-click Live Feed or Flow Scanner rows and choose Add to summary to build an end-of-day digest for your Discord channels. See [Flow Summary and sharing](#flow-summary-and-sharing).
* **Net Premium pane on Atlas.** Add Net Premium from the Atlas Add menu to see the session's cumulative net call and net put premium under your candles. See [Use it with other Skylit tools](#pairing-with-heatseeker-and-atlas).
Glossary
| Term | Meaning |
| ------------------------- | ------------------------------------------------------------------------------------------------------------- |
| **0DTE** | An option that expires today. |
| **Above ask / Below bid** | Printed outside the quoted spread: urgent buying or urgent selling. |
| **Ask side / Bid side** | Printed at or near the ask (leans bought) or the bid (leans sold). |
| **Bull/Bear** | A contract's split between bullish flow (calls bought, puts sold) and bearish flow (calls sold, puts bought). |
| **Chain Bull/Bear** | The same split across the ticker's whole chain. |
| **Contract Ratio** | A contract's bid/mid/ask mix. |
| **Cross** | A trade whose two sides were matched before it printed. Its side does not signal aggression. |
| **Dark pool print** | An off-exchange stock trade. No side, so no direction by itself. |
| **Delta OI** | Change in open interest from one session to the next; confirms whether positions were opened. |
| **DTE** | Days to expiration. 0 means it expires today. |
| **Flow** | The stream of options trades (prints) as they happen. |
| **Flow Score** | Directional score from -100 (bearish) to +100 (bullish). A ranking aid, not a forecast. |
| **ITM / ATM / OTM** | In, at or out of the money: whether the strike is past, at or short of the stock price. |
| **IV** | Implied volatility: how big a move the option's price assumes. |
| **Market Tide** | The market's cumulative net call premium and net put premium through the session. |
| **Mid** | Printed near the midpoint of the spread: neither clearly bought nor sold. |
| **Multi-leg** | A print that is part of a spread or combo. |
| **NCP / NPP** | Net call premium and net put premium. |
| **Net Impact** | A ticker's NCP minus NPP for the day. |
| **Open interest (OI)** | Contracts open at the prior close. |
| **OTM / % OTM** | How far out of the money the strike is. |
| **OPRA** | The body that publishes US options trades. |
| **Print** | One reported trade. |
| **Premium** | Dollars traded: price × size × 100. |
| **Repetitive hits** | Several similar-size ask-side bursts in one contract over a week. |
| **Side** | Where a print filled against the bid and ask. |
| **Size > OI** | A single print larger than the contract's open interest. |
| **Sweep** | An order filled across several exchanges at once. |
| **Vol/OI** | Today's volume divided by open interest. |