> ## Documentation Index
> Fetch the complete documentation index at: https://docs.skylit.ai/llms.txt
> Use this file to discover all available pages before exploring further.
# Tempest field guide
> See how big a move options are pricing for any stock, and whether that is a lot for that stock compared with its own history.
Educational material, not financial advice. Nothing here is a recommendation to buy or sell any security. Options involve significant risk and are not suitable for every investor. Past behavior of any reading or setup does not guarantee future results.
**Beta.** Tempest is in beta for Pro members. Readings, panels and names can change while it is in beta. Not on Pro yet, or want to hear when Tempest opens wider? [Join the Tempest waitlist](https://www.skylit.ai/?waitlist=tempest\&utm_source=docs).
Why it matters
Every option price carries a guess about how far the stock will move. Tempest reads that guess for you. It answers one question: **how much movement are options paying for, and is that a lot for this stock?**
That tells you three things:
* **How far options are pricing the stock to move** by today's close, this week or this month, in dollars. Traders use it as a yardstick for targets, stops and strikes.
* **Whether options are cheap or expensive right now** compared with the stock's own past.
* **Whether today's move is ordinary or unusual** for this stock, measured on its own ruler.
**In plain English.** Option prices carry the market's guess of how much a stock will move. Expensive options mean it is bracing for big swings; cheap ones, a quiet stretch. SVX turns that guess into one number per stock, as the VIX does for the S\&P 500. It sizes the swing, not its direction.
Where to find it
Tempest is available to Pro members during the beta.
1. In the sidebar, open the **Heatseeker** menu and pick **Tempest**. On a phone, tap the **Tempest** button in the nav bar.
2. Tempest opens on the radar. Type any ticker in the search box at the top to open that stock.
| You want | Go to |
| ---------------------------------------------------------------------------- | ------------------------------------------------------------------------------------------------------------------------------------- |
| Rank the whole market by rich or cheap options | Tempest > Radar (sort by any column, or pick a preset) |
| Group by sector, theme or Mag 7 | Radar > Group (on a phone: the Filters sheet) |
| Everything on one stock | Tempest > search the ticker (Summary, SVX, Moves, History, Skew, Imbalance, Earnings, Term, Sigma) |
| Long history, usual range, skew line | Ticker > SVX history (3M to All, "Usual range", "Weekend-adjusted", "Put vs call skew") |
| Past episodes of today's conditions for this stock | Ticker > Setups (right under the summary) |
| How often this stock reached an at-the-money option's break-even in the past | Ticker > Expected move > Calibrated odds |
| Expected-move bands on your chart | Atlas > plugins > Tempest (bands, levels and horizons in its settings) |
| Tempest next to a live chart | Atlas > the Aegis panel > Tempest tab |
| The S\&P 500's volatility mood | Tempest > Market tab |
| Fear & Greed, Mag 7 dispersion | Tempest > Market tab (the score also sits in the strip on every Tempest page) |
| Dealer walls and exposure skew | The Heatseeker board (Tempest itself does not show dealer positioning). Talon can also give an upside or downside exposure-skew read. |
| Ask in plain English, or combine Tempest with Heatseeker | Talon: see [Ask Talon](#talon) |
What Tempest measures
Every reading answers the same question: how much movement options are paying for, and whether that is a lot for this stock.
SVX (Skylit Volatility Index)
SVX is a VIX-style reading built for each stock from its own options. Like the VIX, it is stated as a yearly percentage. `SVX30` covers the next month, `SVX9` about two weeks, `SVX1D` the next session, `SVX3M` the next quarter.
To turn SVX into a price move, divide by the square root of time:
| SVX | Per day (÷√252) | Per week (÷√52) | Per month (÷√12) | Typical of |
| --- | --------------- | --------------- | ---------------- | ---------------------------------------------- |
| 15 | ±0.94% | ±2.08% | ±4.33% | S\&P 500 in a calm tape |
| 30 | ±1.89% | ±4.16% | ±8.66% | Mega-cap tech on an ordinary day |
| 50 | ±3.15% | ±6.93% | ±14.4% | High-beta tech |
| 80 | ±5.04% | ±11.1% | ±23.1% | Small-cap momentum, crypto proxies |
| 100 | ±6.30% | ±13.9% | ±28.9% | Meme / biotech names, or a large-cap in crisis |
| 150 | ±9.45% | ±20.8% | ±43.3% | Binary-event names |
These are 1σ (one standard deviation) moves. In the textbook bell curve, price finishes inside them on about 68% of days, and inside twice that on about 95%. Real stocks have more big days than the textbook.
**Vol points** are the gap between two of these yearly readings. SVX 32 against SVX 30 is a 2 vol point gap.
Weekend-adjusted readings
SVX counts every calendar day, weekends included, as the VIX does. Stocks barely move on a Saturday, so options priced across a weekend look "cheaper per day" on a Friday afternoon and snap back on Monday. Left alone, the history line would saw-tooth every week and every Friday would look cheap just for being a Friday.
So Tempest keeps two versions of each reading:
* **SVX (standard)**: the headline number on every tile, card and radar column. Comparable with the VIX and with implied volatility quoted elsewhere.
* **SVX (weekend-adjusted)**: the same prices with that weekly calendar pattern taken out. Percentiles, IV rank, the usual-range band, setups, implied-vs-realized and Fear & Greed all use it, and the history chart shows it by default (the **Weekend-adjusted** checkbox switches to the standard line).
In a normal week the two sit close together. The adjusted one is just steadier from Friday to Monday.
The readings, and the question each answers
| Reading | It answers | What traders read from it |
| ----------------------------------------------- | ------------------------------------------------------------------------------- | ----------------------------------------------------------------------------------------------------------------------------------------------------------------------------------------- |
| **SVX %ile** (e.g. 30D vs 1y) | Are options expensive or cheap *for this stock*? | The main lens. The radar's presets call 80 or more rich and 20 or less cheap. Pick the horizon that matches the period you care about (1D next session, 9D about two weeks, 30D a month). |
| **IV rank 1y** | Where today sits between the year's low and high | A cross-check on the percentile. One spike can distort rank but not percentile. |
| **Term 9–30** / curve | Is near-term fear above longer-term? | Positive (backwardation) = stress or an event now. Negative (contango) = normal, calm. |
| **Expected move / cones** | How far options are pricing price to move by a date | A yardstick for targets, stops and strikes. Drawn on Atlas as bands. |
| **Sigma (σ)** | How big today's move was, in expected moves | Under 1σ is ordinary; in the textbook, 2σ happens on about 5% of days and 3σ on about 0.3%. |
| **Skew** (put vs call, %ile) | Are downside puts priced above upside calls? | Puts richer than usual = the crowd is paying for protection. A skew flip toward calls = demand for upside. |
| **Premium imbalance** | At the same distance from price, which side is cheap? | Whether calls or puts are priced lower relative to each other. Only counted on actively traded contracts. |
| **Earnings** · **VRP** (implied minus realized) | Is the report priced above or below the stock's past moves? | How this report's pricing compares with the stock's past reactions. |
| **Settling back** | After readings like today's, how often did SVX return to normal within a month? | Historical context for how quickly high or low readings have eased back for this stock. |
| **SVX / S\&P** | How jumpy is this stock versus the index? | 2.0 = priced to move twice as much as the S\&P 500. |
Read it in 30 seconds
Search a ticker in Tempest, then read it top to bottom:
1. **How big is the priced move?** Read the next-day and weekly expected move in % and \$. Many traders use it as a yardstick for targets and stops.
2. **Is it rich or cheap for this stock?** Read the SVX percentile, not the raw SVX. A 61 can be expensive for one stock and cheap for another.
3. **Why?** Check the earnings date, the term structure and the E markers on the history chart. Expensive options ahead of a known event have an obvious reason. Expensive options with no event in sight are harder to explain.
4. **Priced vs delivered.** Compare the Straddle and Realized columns in Expected move. Implied well above realized means options are charging for more movement than the stock has been making.
5. **Which side?** Skew and premium imbalance show whether calls or puts are priced lower relative to each other.
Is SVX 100 a lot?
On its own, no. SVX 100 means options are pricing about ±6.3% a day and ±29% a month. For SPY that would be a crisis. For a meme stock it can be an ordinary week. That is why the radar ranks by each stock's percentile against its own history, not by raw SVX.
**High SVX means options are expensive, not that they are overpriced.** Premium turns out "inflated" only if the stock then moves less than priced, which nobody knows in advance. Three checks describe how expensive it is today:
* The percentile is 80 or more against the stock's own year.
* Implied is above realized: the straddle or SVX-implied move sits clearly above the Realized column.
* No known event falls inside the window: earnings, FDA, index rebalance.
All three together is as close as Tempest gets to "rich". It is still a description of pricing, not a forecast.
How to use it
Tempest has four places to work from. Each has its own section below.
* **[The radar](#radar-columns-presets)**: rank the whole market by how rich or cheap each stock's options are.
* **[Ticker detail](#ticker-detail-section-by-section)**: everything Tempest knows about one stock, panel by panel, including [a day's sigma](#looking-up-a-days-sigma), [premium imbalance](#premium-imbalance-theory), [setups](#setups-what-happened-next) and [vol-trader reads](#vol-trader-reads).
* **[Atlas cones and levels](#atlas-tempest-cones-levels)**: the expected move drawn on your chart.
* **[The Market tab](#market-tab)**: the S\&P 500's volatility mood and [Skylit Fear & Greed](#skylit-fear-greed).
Then see [patterns traders watch](#patterns-traders-watch) and [how earnings show up](#earnings).
Rank the market: the radar
**Why it matters:** the radar shows which stocks have unusually cheap or expensive options today, each against its own history. No more checking names one by one.
**Where:** Tempest opens on the radar. On desktop it sits on the left; on a phone it is a list of cards with a filter sheet.
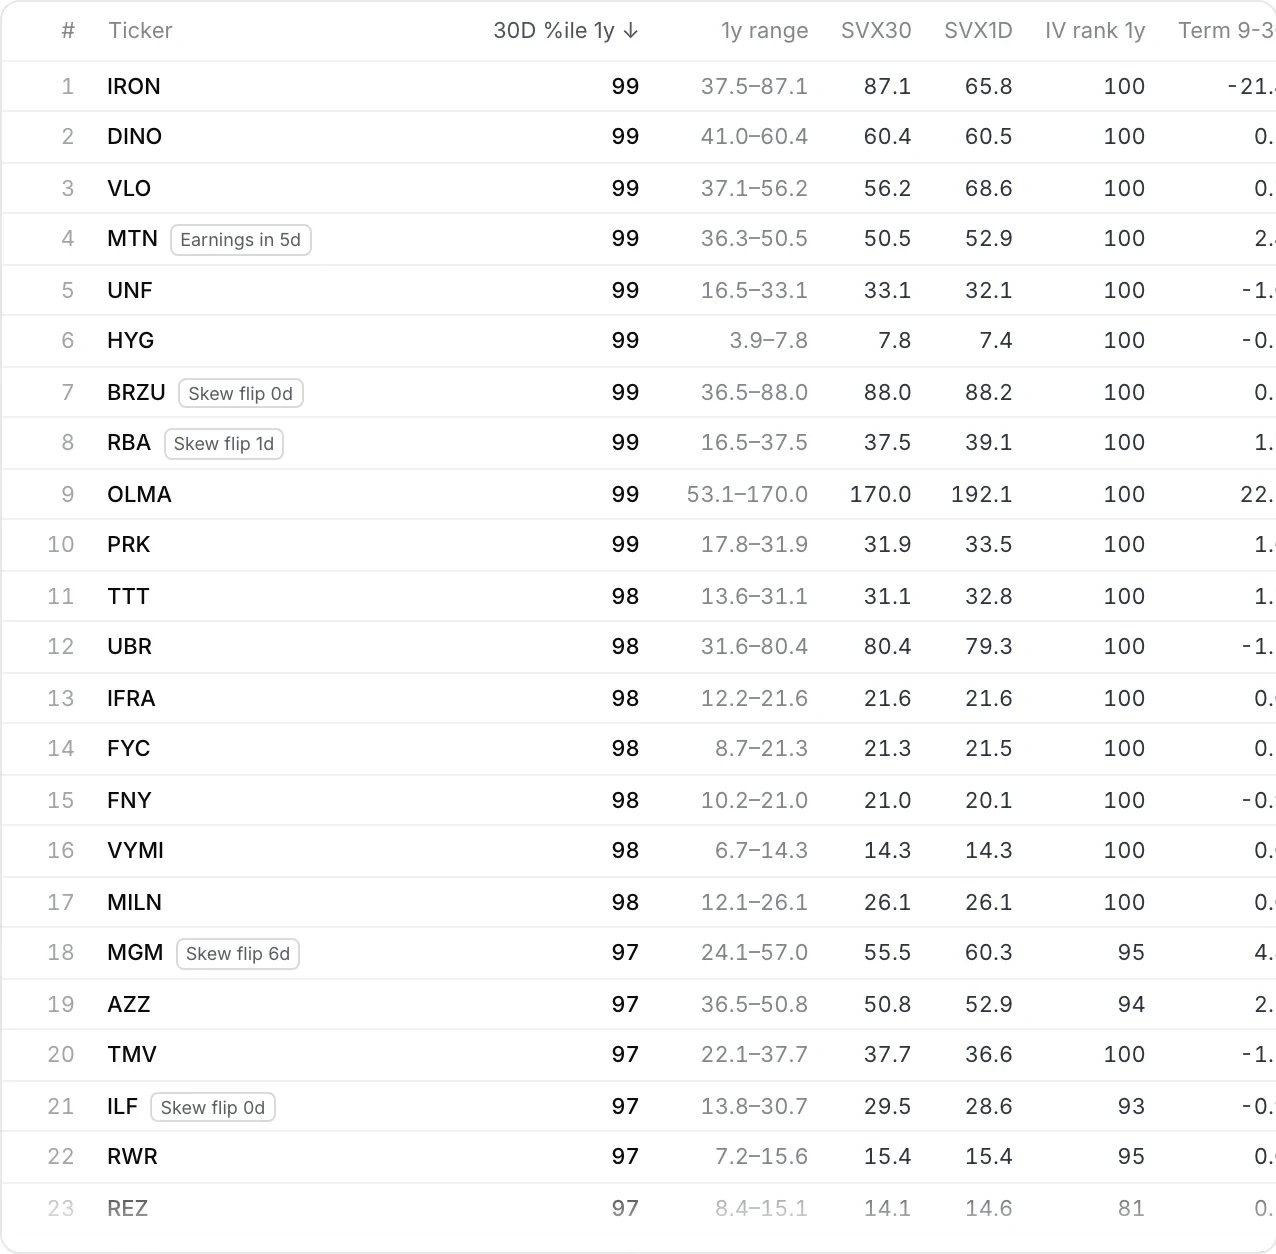
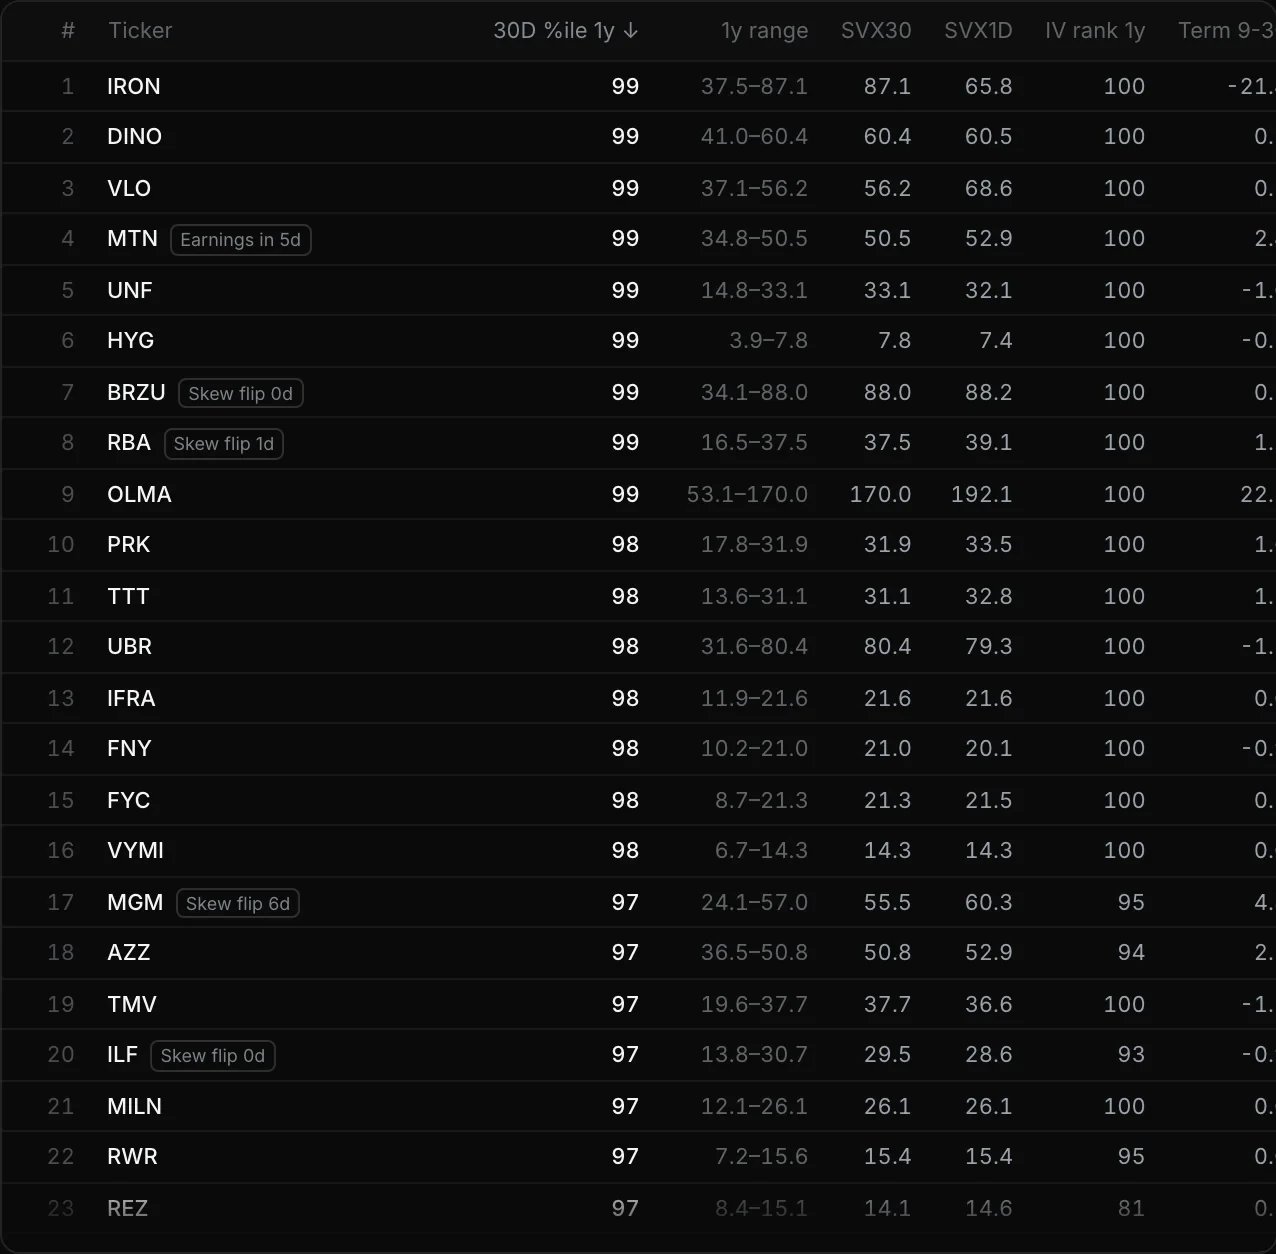
1. Pick the **percentile basis** (Horizon × Lookback, e.g. `30D %ile 1y`). It drives the first column, the Rich/Cheap presets and the group medians.
* Horizon: the period you care about. `1D` for the next session, `9D` for about two weeks, `30D` for the standard read, `3M` for a quarter.
* Lookback (1y, 3y, 5y): how far back "usual" reaches.
2. Pick a **preset** to filter the list, or sort by any column.
3. Click (or tap) a row to open that stock's detail.
 | Column | Meaning | What traders read from it |
| ----------------- | -------------------------------------------------- | ---------------------------------------------------- |
| SVX %ile | Today vs this stock's own past on the chosen basis | The default sort and the main "rich or cheap" read. |
| 1y range | Lowest to highest SVX30 over the year | Context: how far vol has travelled for this stock. |
| SVX30 · SVX1D | Month and next-session readings, as yearly % | SVX1D far above SVX30 = an event or stress tomorrow. |
| IV rank 1y | Position between the year's low (0) and high (100) | Cross-check; a single spike can distort it. |
| Term 9-30 | 9-day minus 30-day reading | Above 0 = backwardation: something is priced soon. |
| Next-close move % | Move priced from now to the next session's close | The size of move priced for tomorrow. |
| Sigma | Today's move in expected moves, with its odds | Where the unusual days show up. |
| SVX / S\&P | This stock's SVX30 ÷ the S\&P 30-day | 2.0 = priced to move twice as much as the index. |
**Extra columns** (desktop, Columns button): Curve, Skew 30d, Skew %ile, Tilt, Cheap side, Earnings in, Earnings move %, VRP, vs sector and **Fear/greed**. *vs sector* is how many percentile points the stock sits above or below its sector's median. *Fear/greed* is each stock's own 0–100 reading (see [Fear & Greed](#skylit-fear-greed)).
**Group** the list by sector or theme (on a phone, in the Filters sheet) to see which groups are rich or cheap as a block. Each group shows its median percentile, median SVX30, median next-day move and how many names are rich. A whole sector going rich at once is a market story. One rich stock in a calm sector is a story about that stock.
| Preset | Keeps | Often watched by |
| ----------------- | ----------------------------------------------------------------------------------------------- | ------------------------------------------------------------------------------------- |
| Rich vol | Percentile 80 or more on the chosen basis | Premium sellers and reversal traders |
| Cheap vol | Percentile 20 or less | Swing and breakout traders |
| Backwardation | 9-day reading above 30-day | Traders watching for events and stress |
| Sigma event | Today's move of 2σ or more either way | Reversal and momentum traders |
| Big mover today | Today's move of 1σ or more | Intraday watchlists |
| Earnings soon | Report within 10 days | Event traders |
| Premium imbalance | One side unusually cheap, on actively traded contracts | Traders comparing calls and puts (see [premium imbalance](#premium-imbalance-theory)) |
| Put skew extreme | Skew %ile 90 or more | Traders watching hedging demand |
| Rich vs realized | Implied 5 or more vol points above recent realized | Premium sellers |
| Skew flip | Skew just flipped from puts-rich to calls-rich (the badge shows how many sessions ago) | Swing and breakout traders |
| Coiled | Skew flipped to calls and sits at its yearly lows, calls are the cheap side, and vol isn't rich | Traders watching quiet stocks (see [Setups](#setups-what-happened-next)) |
**Hide approximate** is on by default. It drops stocks with rough readings: too few quotes right now, or a share price so low that the numbers get coarse.
| Column | Meaning | What traders read from it |
| ----------------- | -------------------------------------------------- | ---------------------------------------------------- |
| SVX %ile | Today vs this stock's own past on the chosen basis | The default sort and the main "rich or cheap" read. |
| 1y range | Lowest to highest SVX30 over the year | Context: how far vol has travelled for this stock. |
| SVX30 · SVX1D | Month and next-session readings, as yearly % | SVX1D far above SVX30 = an event or stress tomorrow. |
| IV rank 1y | Position between the year's low (0) and high (100) | Cross-check; a single spike can distort it. |
| Term 9-30 | 9-day minus 30-day reading | Above 0 = backwardation: something is priced soon. |
| Next-close move % | Move priced from now to the next session's close | The size of move priced for tomorrow. |
| Sigma | Today's move in expected moves, with its odds | Where the unusual days show up. |
| SVX / S\&P | This stock's SVX30 ÷ the S\&P 30-day | 2.0 = priced to move twice as much as the index. |
**Extra columns** (desktop, Columns button): Curve, Skew 30d, Skew %ile, Tilt, Cheap side, Earnings in, Earnings move %, VRP, vs sector and **Fear/greed**. *vs sector* is how many percentile points the stock sits above or below its sector's median. *Fear/greed* is each stock's own 0–100 reading (see [Fear & Greed](#skylit-fear-greed)).
**Group** the list by sector or theme (on a phone, in the Filters sheet) to see which groups are rich or cheap as a block. Each group shows its median percentile, median SVX30, median next-day move and how many names are rich. A whole sector going rich at once is a market story. One rich stock in a calm sector is a story about that stock.
| Preset | Keeps | Often watched by |
| ----------------- | ----------------------------------------------------------------------------------------------- | ------------------------------------------------------------------------------------- |
| Rich vol | Percentile 80 or more on the chosen basis | Premium sellers and reversal traders |
| Cheap vol | Percentile 20 or less | Swing and breakout traders |
| Backwardation | 9-day reading above 30-day | Traders watching for events and stress |
| Sigma event | Today's move of 2σ or more either way | Reversal and momentum traders |
| Big mover today | Today's move of 1σ or more | Intraday watchlists |
| Earnings soon | Report within 10 days | Event traders |
| Premium imbalance | One side unusually cheap, on actively traded contracts | Traders comparing calls and puts (see [premium imbalance](#premium-imbalance-theory)) |
| Put skew extreme | Skew %ile 90 or more | Traders watching hedging demand |
| Rich vs realized | Implied 5 or more vol points above recent realized | Premium sellers |
| Skew flip | Skew just flipped from puts-rich to calls-rich (the badge shows how many sessions ago) | Swing and breakout traders |
| Coiled | Skew flipped to calls and sits at its yearly lows, calls are the cheap side, and vol isn't rich | Traders watching quiet stocks (see [Setups](#setups-what-happened-next)) |
**Hide approximate** is on by default. It drops stocks with rough readings: too few quotes right now, or a share price so low that the numbers get coarse.
Why the radar shows fewer names than Tempest covers
The count above the radar reads "N of \ names". Tap or hover it to see where the rest are:
* **Priced under \$5 — approximate**: on the radar, hidden while *Hide approximate* is on.
* **Hidden by your filters**: presets, sectors, themes, watchlists.
* **Too few quoted contracts for a reliable reading**: only a few of the name's option contracts had two-sided quotes, so a volatility reading wouldn't be reliable. These stay off the radar and out of rankings.
* **No option quotes this session**: the name has listed options, but none were quoted.
* **No listed options**: no listed options were found for the symbol.
* **Couldn't be read on the last pass**: retried automatically.
* **Not reached yet**: right after Tempest starts, during market hours; appears within minutes.
Searching for a name that isn't on the radar still opens it, with a short note saying why. Thin names keep their flagged readings below that note.
Read one stock: ticker detail
**Why it matters:** one page shows how far the stock is priced to move and whether that is cheap or expensive for it. It also shows which side, calls or puts, is priced lower.
**Where:** search a ticker in Tempest, or click a row on the radar. On a phone, the detail has a pinned header whose tabs jump between sections.
1. Read the **Summary** at the top first.
2. Jump to a section with the section tabs, or scroll.
3. Tap a panel's header to fold or unfold it. Tempest remembers your choice.
Summary, Setups, SVX, Expected move, History, Skew and Sigma start open. Implied vs actual, Imbalance, Earnings and Term start folded with a one-line teaser. The section tabs open whatever they jump to.
**On desktop** the radar and the ticker detail scroll independently, both below the toolbar. Drag the divider between them to resize (double-click resets it, arrow keys nudge it). Tempest remembers the split in your browser.
Summary
The panel is titled **In plain English**: a few sentences that read the whole picture. On a phone it opens with three numbers first: the **next-day move** (% and \$), **SVX30** with its percentile, and **today's σ** with its odds.
SVX
* **SVX %ile 1y** (the large number) with the 1y range and how many sessions it rests on. Under about 60 sessions, treat percentiles as provisional.
* **Tiles:** SVX30, SVX1D, SVX9, SVX3M, SVX6M, each with its price-terms translation (for example "≈ ±16%/month"), plus IV rank, SVX/S\&P, Term 9-30 and Curve.
* **SVX across horizons:** a grid of percentiles, horizon (rows) × lookback (columns). Shading gets lighter as percentiles rise. Use it to see *where* the richness sits. A hot 1D row with a cool 3M row points to an event. Hot across the board is a lasting shift.
* **Settling back:** a gauge of SVX30 against this stock's usual range (its middle 60% of days, median marked). Below it, one sentence covers the past times SVX was this high (or low). It says how often SVX was back to usual within a month, how long that took, and how many episodes that rests on. Under 5 episodes, it says there isn't enough history. It describes this stock's past, not what SVX will do next.
Expected move
One row per horizon: **Today** (to today's close), **Next day**, **This week** (to Friday's close), **Monthly exp.** (to the third Friday) and **30 days**. Each row shows the 1σ move in % and \$, the price range it implies, the 2σ move, and two cross-checks:
* **Straddle**: the move implied by at-the-money options alone. It should roughly agree with the main number. A large gap means the far strikes are priced differently from the middle.
* **Realized**: how much the stock has actually been moving, scaled to the same horizon. Implied well above realized means options are charging for more movement than the stock has been making. Implied below realized means options are behind the stock.
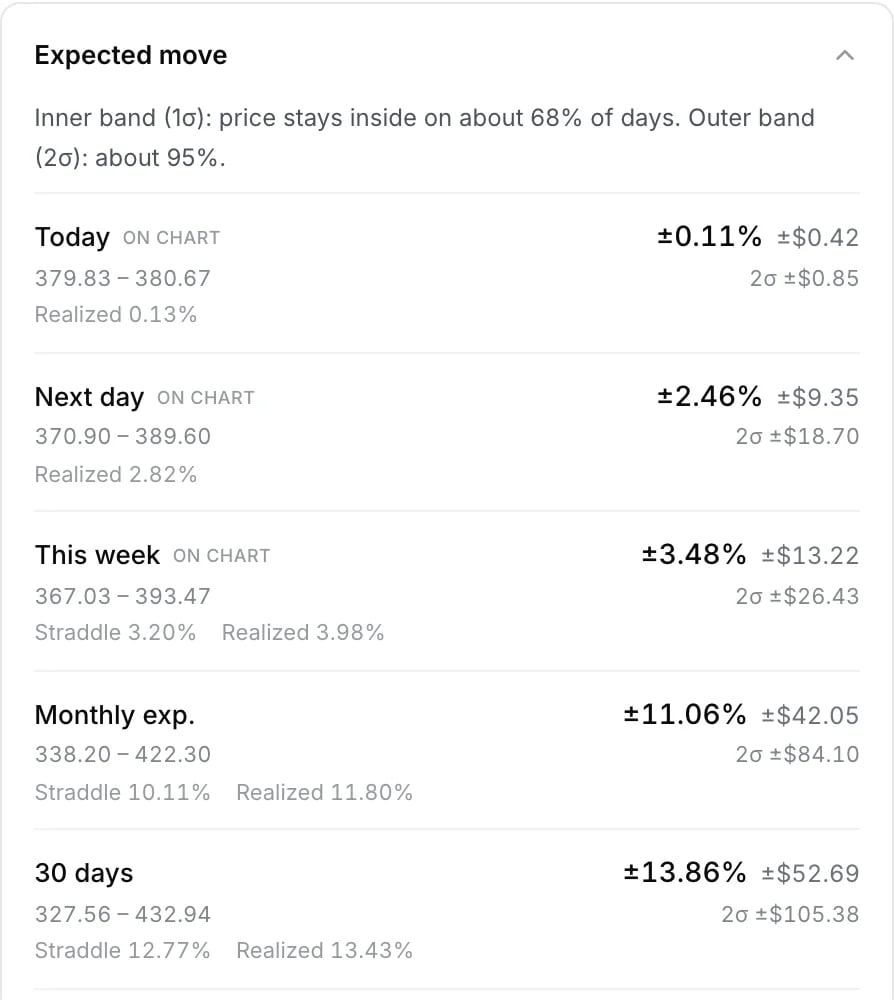
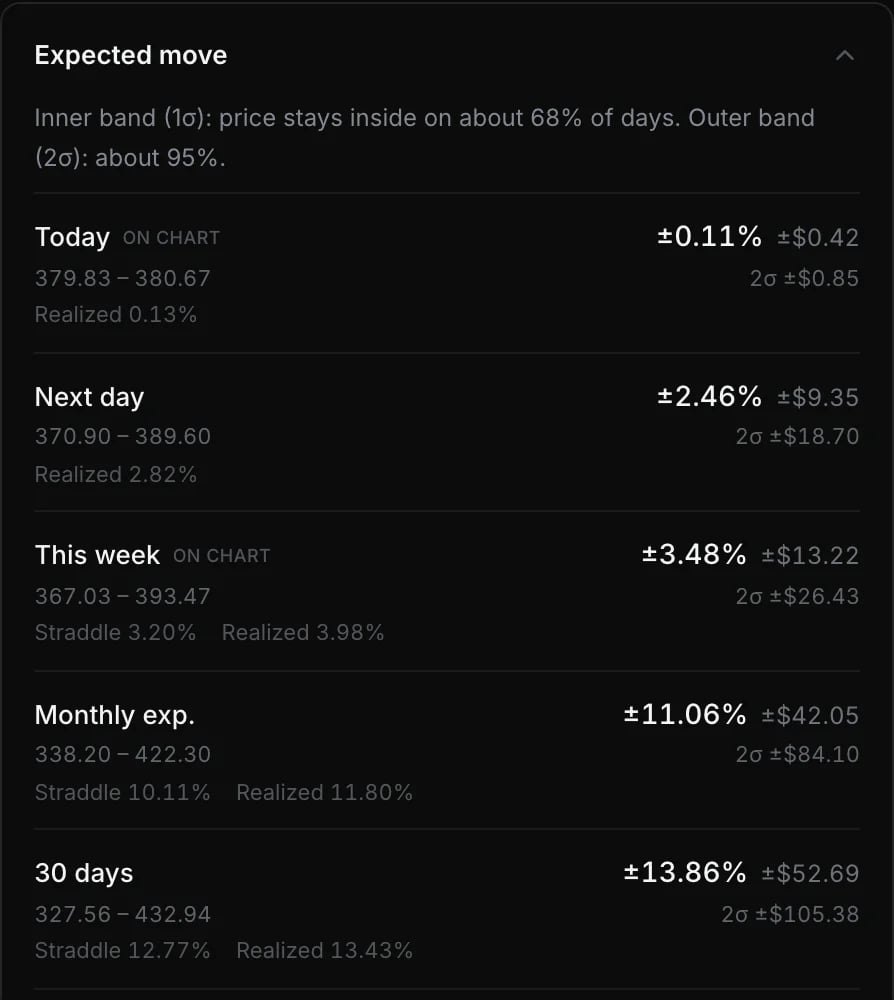 When price is already outside today's range, a neutral note says by how much, e.g. "Above today's expected range by \$0.56 (+1.80σ)". "On chart" marks the horizons currently drawn on Atlas.
SVX history
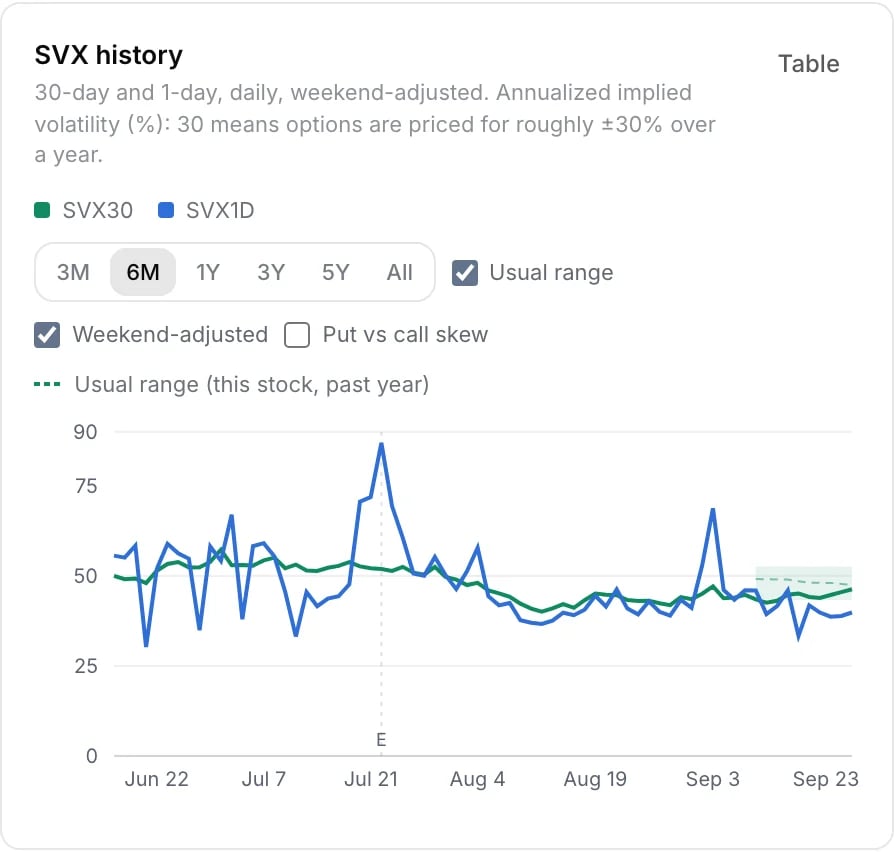
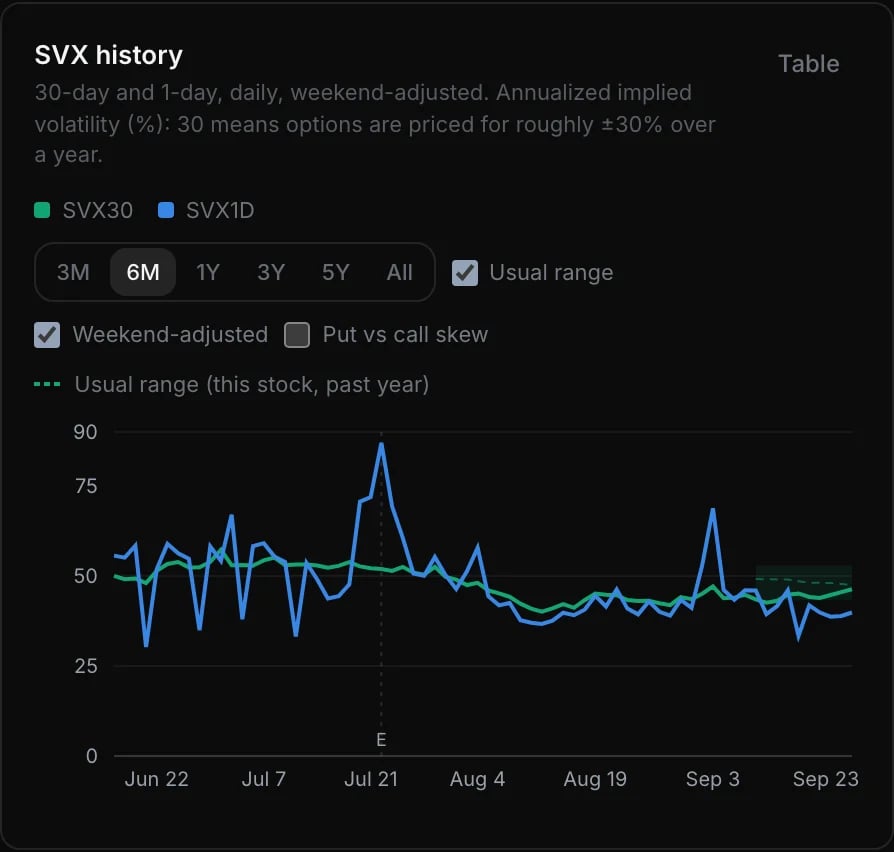
* SVX30 and SVX1D over **3M, 6M, 1Y, 3Y, 5Y or All**. The longer ranges switch to weekly points.
* **Usual range** band: where SVX30 sat on the middle 60% of days over the prior year, with a dashed median. Readings above the band are rich, below it cheap, each judged against what was usual at that time.
* **Put vs call skew** line (toggle): above 0 puts cost more (demand for protection), below 0 calls cost more (demand for upside).
* **E markers** flag the night before earnings, when SVX1D spikes by design because it includes the report move.
* **Weekend-adjusted** by default, so the line does not dip every Friday and bounce every Monday. Untick **Weekend-adjusted** to see the standard (VIX-style) readings. See [Weekend-adjusted readings](#weekend-adjusted-readings).
Skew
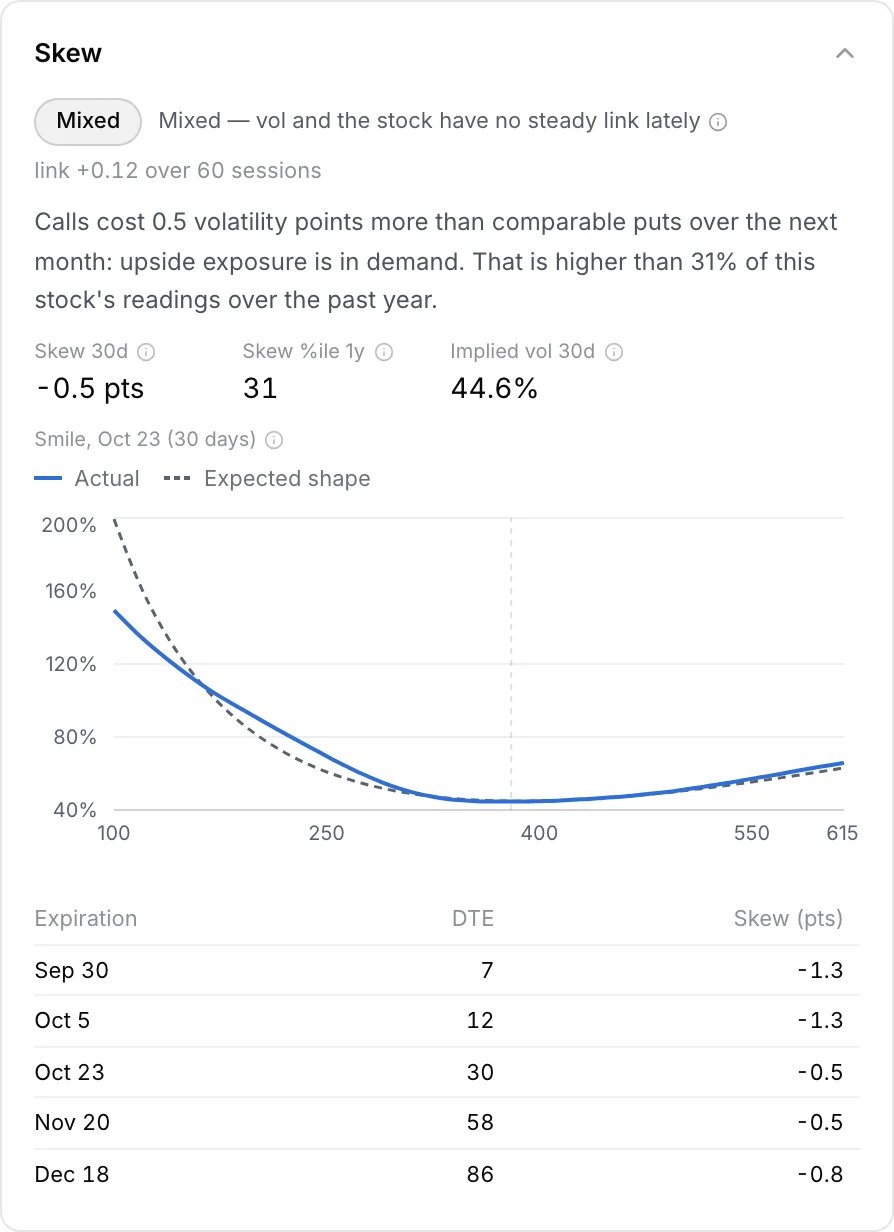
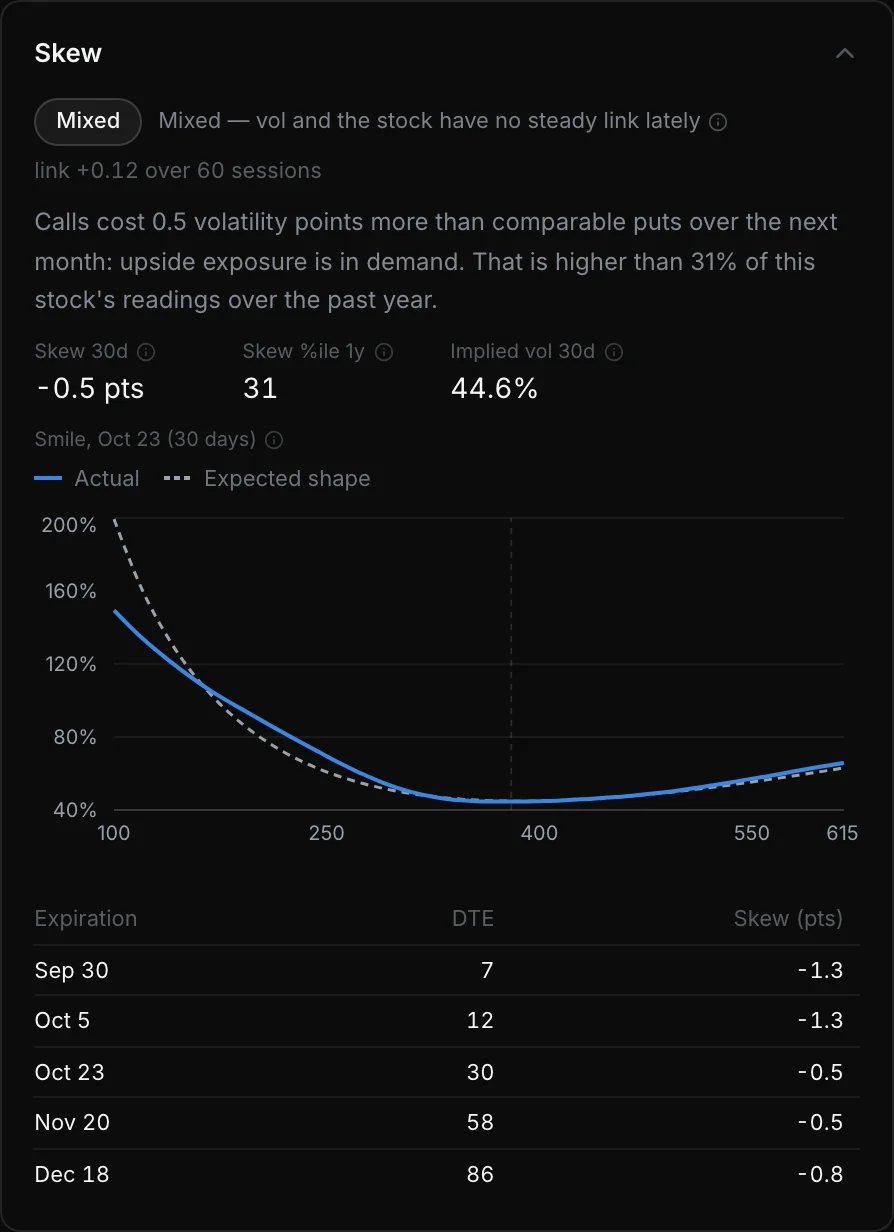
**In plain English.** Skew compares what traders pay for downside insurance (puts) with what they pay for upside bets (calls) the same distance from price. On most stocks puts cost more, the way flood insurance costs more near a river. When that gap narrows or flips toward calls, the crowd has started paying for upside.
* **Skew 30d**: how many vol points protective puts cost above comparable calls, about a month out. **Skew %ile 1y** says whether that is unusual for this stock.
* **Implied vol 30d** for the same expiry.
* **Smile**: implied vol across strikes for the roughly one-month expiry, drawn next to its expected shape. Points far above the shape are locally expensive strikes; far below, locally cheap.
* **Per-expiry skew** table: skew for each expiration. A front expiry far more skewed than later ones = near-term fear.
Premium imbalance
Which side is cheap, how lopsided, how unusual, and whether the contracts trade well enough to trust. Full explanation in [Premium imbalance](#premium-imbalance-theory).
Earnings
* **Earnings in** (days), **priced move (1σ)** for the report day, and the **typical past move** after recent reports.
* **Past reactions** as bars, one per recent report, signed.
* **VRP box**: how many vol points implied sits above recent realized, with its percentile. It also shows how often, over the past year, options priced more movement than the stock then delivered ("pricier than what followed"). That is a description of the past year, not a forecast.
Term structure
**In plain English.** Normally the market is calmer about next week than about the months after, so near-dated vol sits below later-dated vol. That is contango, the calm state. When next week is priced as rougher than the months after, that is backwardation: an event is coming, or stress is already underway.
One row per expiration: days to expiry, implied vol and the straddle-implied 1σ move. The implied vol is read across all strikes, so it runs a little above the at-the-money figure brokers show. The table shows how pricing changes from one expiry to the next. A kink up at one date usually marks an event. This section starts folded.
Sigma
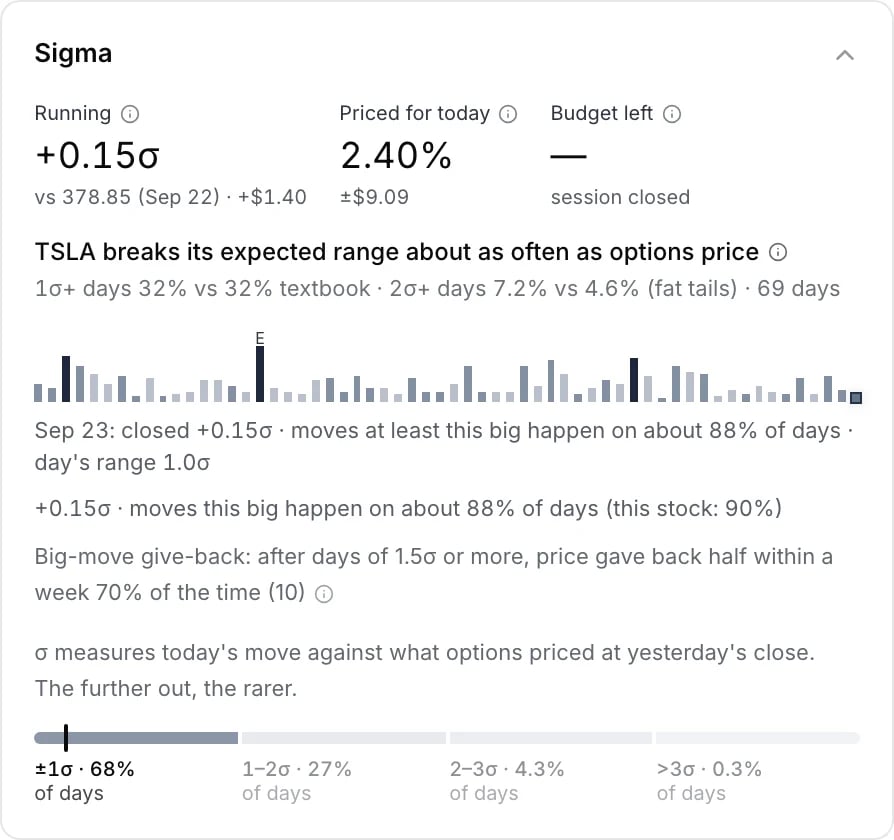
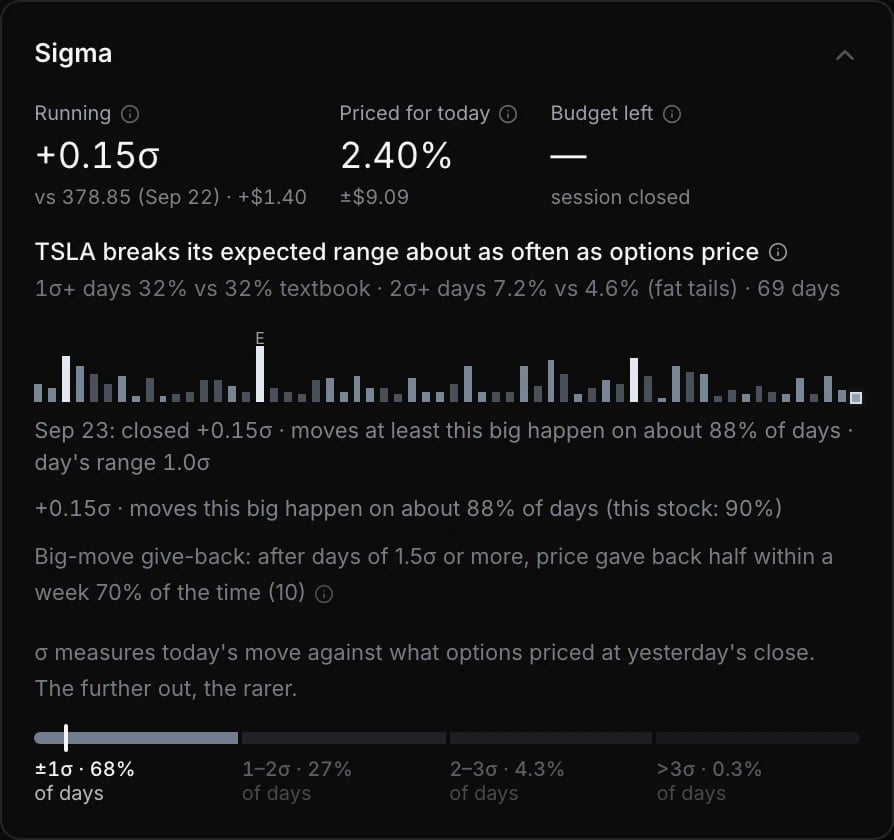
**In plain English.** Sigma measures today's move with the stock's own ruler. If options price a stock for about 2% a day, a 4% day is 2σ. If SPY is priced for about 1%, a 2% day is also 2σ. That makes a quiet index and a jumpy small cap comparable.
* **Running**: today's move so far in σ, with the prior close, its date and the move in dollars ("vs 773.52 (Sep 22) · −\$0.08").
* **Last big move**: a chip for the latest 1.5σ+ session in the past week, e.g. "Sep 21 +2.27σ · a 2.3% day".
* **Calibration**: one line on whether this stock has broken its expected range more or less often than options priced, over its recent history. Example: "SPY breaks its expected range less often than options price: 1σ+ days 22% vs 32%". A **fat tails** flag appears when its 2σ days have run well above the textbook rate.
* **Priced for today**: the move options priced at the prior close for today's session, in % and \$.
* **Budget left**: how much movement options still price between now and the close ("session closed" outside regular hours).
* **The 60-session strip**: tap or drag to read any day (see [Look up a day's sigma](#looking-up-a-days-sigma)). 2σ+ days are drawn brighter so they stand out without tapping; E marks earnings reactions.
* **Odds**: how often moves this big happen, textbook vs this stock's own history. A stock whose own 2σ days happen far more often than 5% has fat tails.
* **Big-move give-back**: after past 1.5σ+ days, how often price gave back at least half within a week, with the number of episodes. It describes this stock's past, not what happens after the next big day.
* **Sigma scale**: the four textbook bands (within ±1σ 68%, 1–2σ 27%, 2–3σ 4.3%, beyond 3σ 0.3%) with today's band highlighted.
Look up a day's sigma
**Why it matters:** one tap tells you whether yesterday, or any of the last 60 sessions, was ordinary for that stock or rare.
**Where:** Tempest > search a ticker > **Sigma**. A shorter strip (the last 30 sessions) is in the Aegis Tempest tab on Atlas.
1. Open **Tempest** (sidebar Heatseeker menu, or the Tempest button in the phone nav bar) and search the ticker.
2. Go to **Sigma** (on a phone, tap the *Sigma* tab in the pinned header).
3. The strip shows the last 60 sessions, with the tallest bars the biggest moves. It opens on the latest session. Tap or drag across it (arrow keys on desktop) to read any day.
The readout says, for example: `Sep 22: closed −0.02σ · moves at least this big happen on about 99% of days · day's range 0.5σ`. A normal day, in other words.
"Closed" measures close-to-close against the move options priced at the prior close. "Day's range" measures high-to-low in the same units.
Premium imbalance: which side is cheap
**Why it matters:** it shows whether calls or puts are priced lower relative to each other today, after allowing for the stock's usual tilt.
**Where:** Ticker detail > **Imbalance**, the **Premium imbalance** preset on the radar, and the Tilt and Cheap side columns (Columns button).
**In plain English.** Think of a shop that always charges more for umbrellas than sunglasses. That markup is normal. Premium imbalance asks whether umbrellas, or sunglasses, are unusually cheap *today* compared with that shop's usual markup. Puts are the umbrellas; calls are the sunglasses.
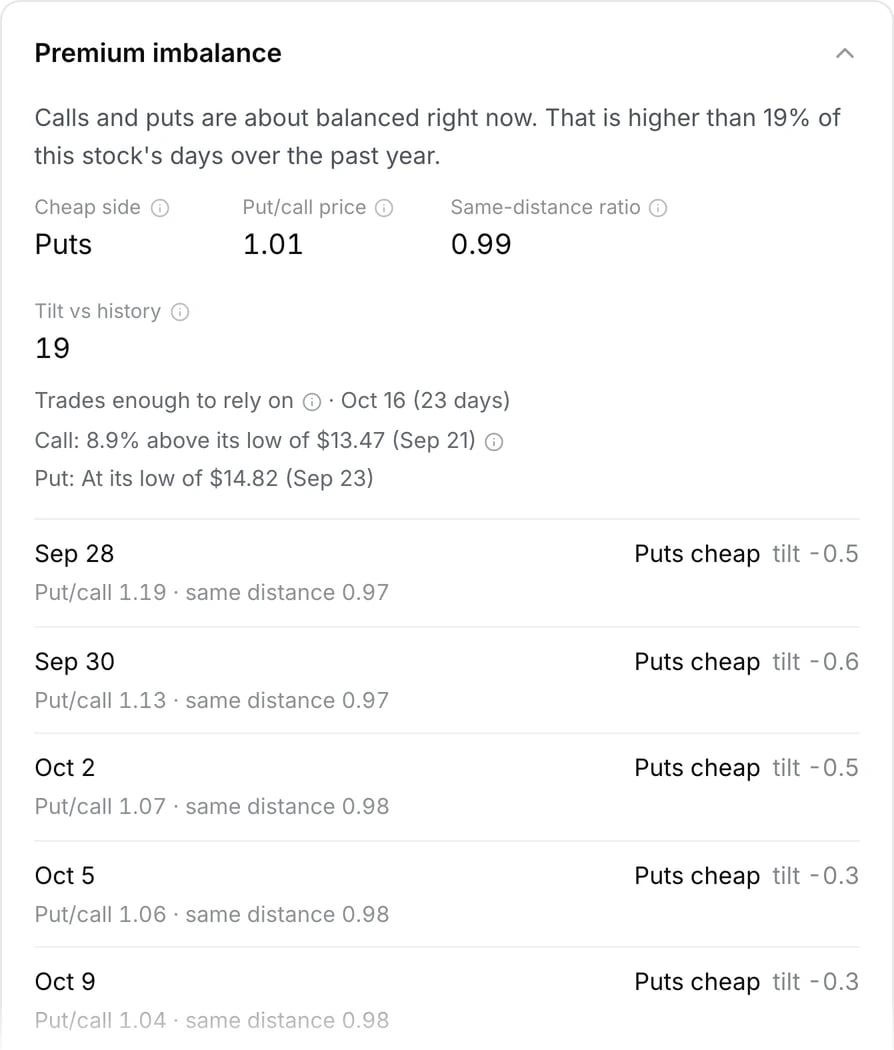
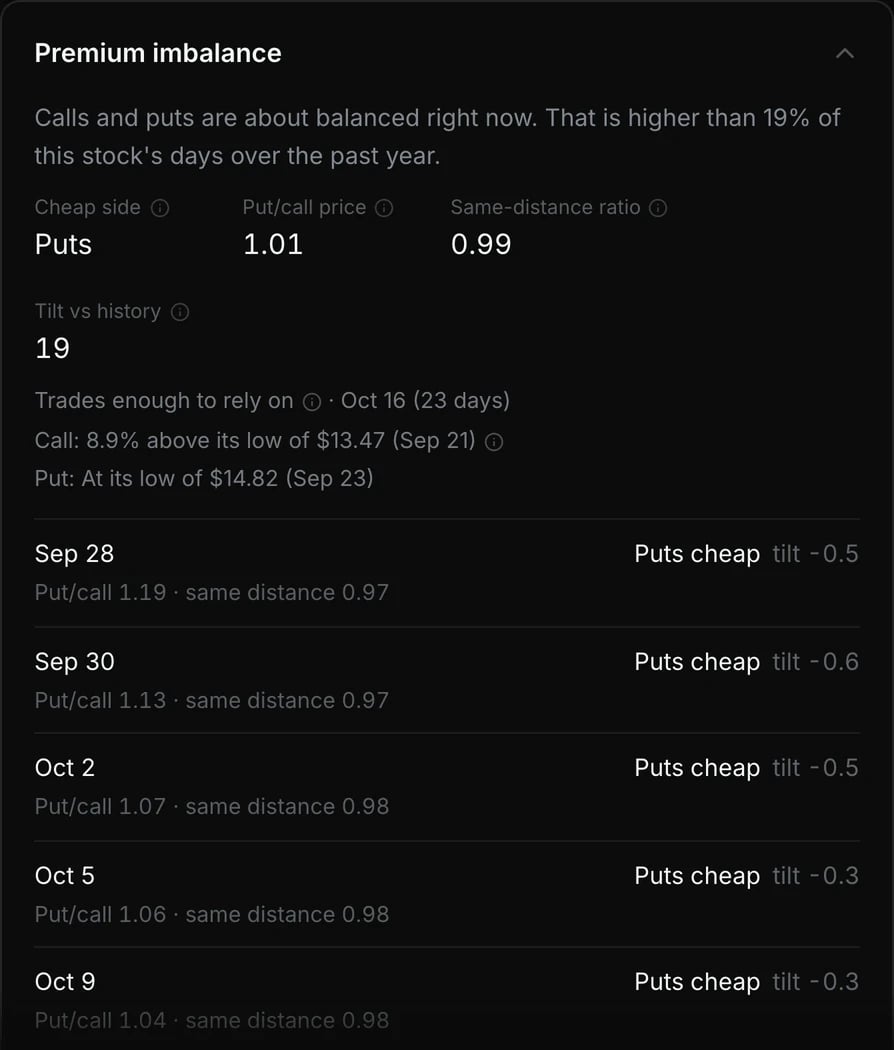
**The idea:** options are not priced evenly on both sides. Out-of-the-money puts normally cost more than calls the same distance away, because investors pay up for crash protection. Every stock has its own normal tilt. Premium imbalance asks a sharper question: *after allowing for that normal tilt, is one side unusually cheap today?*
To read it:
1. Open a ticker and unfold **Imbalance** (it starts folded).
2. Read **Cheap side** first. Then read **Tilt** and **Tilt vs history** to see how lopsided and how unusual it is.
3. Check that the contracts trade well enough to trust (see the guards below).
To find names across the market, pick the **Premium imbalance** preset on the radar.
The readings, from rough to refined
| Reading | What it is | Why it isn't enough alone |
| -------------------------- | ------------------------------------------------------------------------------------------------------------------------------------------------- | ---------------------------------------------------------------------------------------------------- |
| **Put/call price** | Price of the nearest out-of-the-money put ÷ nearest out-of-the-money call | The two strikes can sit at different distances from price, so the ratio mixes distance with pricing. |
| **Same-distance ratio** | The same ratio with both legs equally far from the current price | Fixes distance, but still includes the normal put premium every stock carries. |
| **Tilt** (vol pts) | How lopsided the two sides are *after* removing the stock's normal curve. Positive = puts rich / calls cheap; negative = calls rich / puts cheap. | This is the core number. |
| **Tilt vs history** (%ile) | Today's tilt against this stock's own past year ("new" while history is short) | Separates a genuinely unusual day from a stock that is always lopsided. |
| **Cheap side** | Calls or puts: whichever is priced low relative to the other | The one-word answer. Read it with the tilt and the guards below. |
The legs
The headline expiry is the one nearest about three weeks out. For it, the ticker detail shows how far each leg, the call and the put, trades **above its lowest price** since it started trading, with that low and its date ("At its low" when it is there). On the radar, the **Premium imbalance** preset switches to its own columns, including each leg's **price and strike** (*Call price @ strike*, *Put price @ strike*) and *Cheap leg vs its low*.
A cheap side whose leg is also at its low is cheap two ways: against the other side *and* against its own history. The per-expiry table repeats the read for each expiration. That shows whether the imbalance sits on one date or across the whole curve.
Two guards against false readings
* **Liquidity:** the contracts must actually trade, with tight quotes and real interest or volume at that strike. Otherwise the imbalance can come from stale quotes. Only liquid readings count for the radar preset.
* **Consistency:** when nearby strikes disagree in a way that means the reading is off, Tempest marks it inconsistent and never counts it as liquid.
What traders read from it
* **Which side is priced lower.** Traders who have already formed a view look at it to compare calls and puts before choosing between them.
* **Which side is rich.** Premium sellers look at the side that is priced higher than usual.
* **Sentiment.** Calls unusually cheap means few traders are paying for upside. Some traders compare that with Heatseeker's [exposure](#pairing-with-heatseeker).
**Keep in mind.**
* Imbalance tells you which side is *cheaper*, not which way the stock will go.
* Around earnings both sides reprice and the tilt can swing; read it after the report.
* After the close, the liquidity check carries over from the session's last live reading, because official close quotes don't include volume.
Expected moves on your chart
**Why it matters:** you see the priced range right on the candles, as reference levels, without switching screens.
**Where:** on Atlas, open plugins > **Tempest**, then the gear for its settings. The **Tempest** tab in Atlas's **Aegis** panel shows the same readings in a compact panel next to the chart, including the tappable sigma strip. On a phone it opens as a sheet.
1. Turn on the Tempest plugin on Atlas.
2. Open its settings (gear) and choose **Show**: Cones, Levels (Daily range / Weekly range / ±2σ lines), or both.
3. Pick the **Cone horizons** and **Bands** (68%, 95%, Labels, Out-of-range note), then set **Band opacity** so the bands stay readable under your other plugins.
The plugin has two layers that answer different questions.
#### Cones: the priced range from here
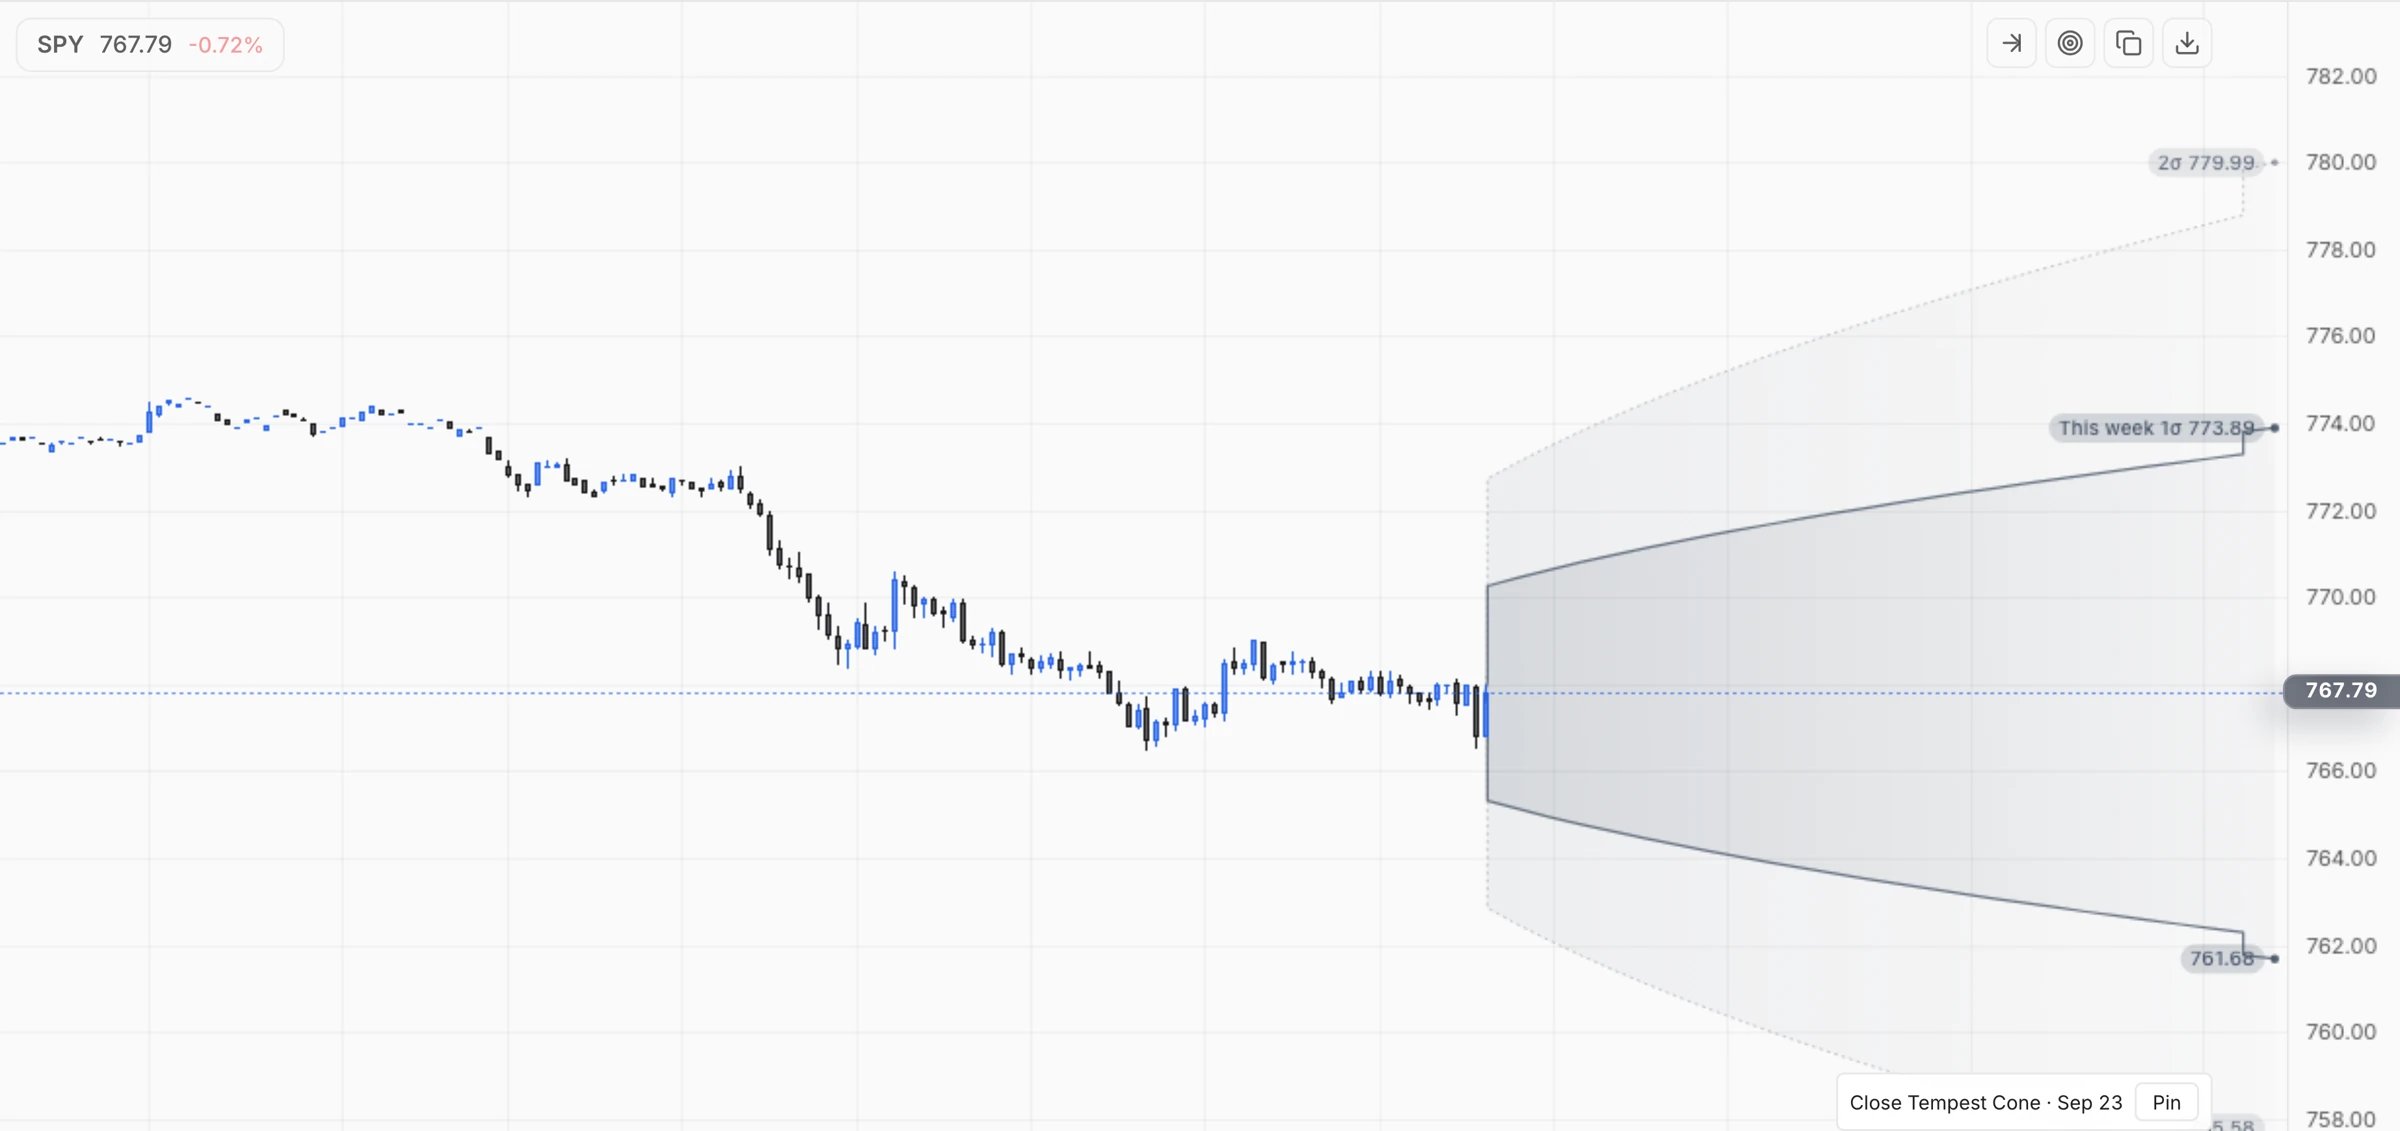
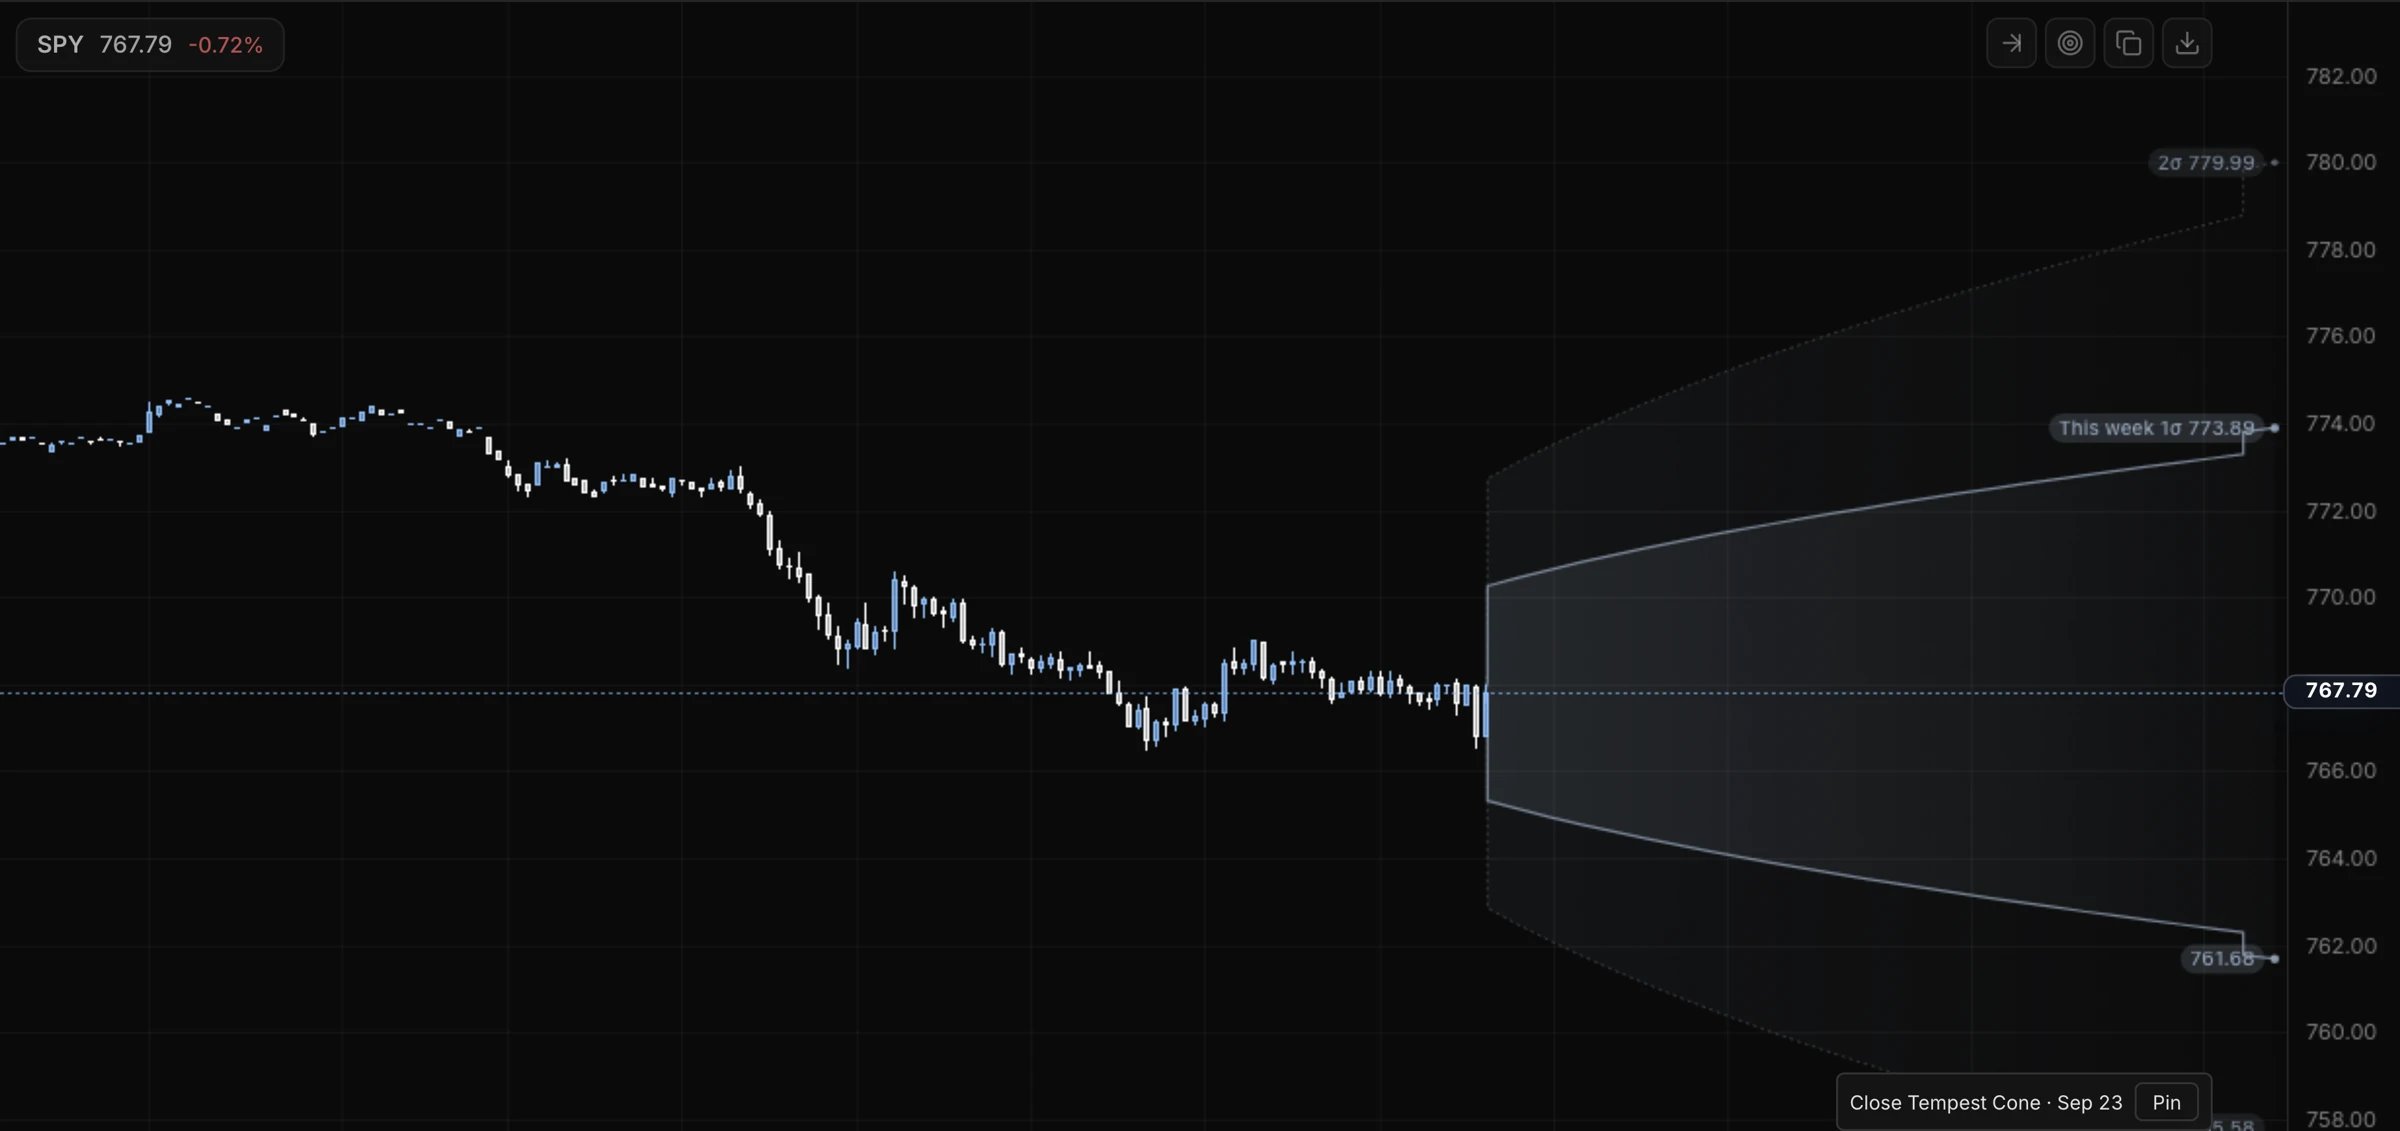
Anchored to the last bar · widen with time
Cones draw the priced range forward from now to the end of each horizon. **Cone horizons:** Today (to the close), Next day, This week (to Friday), Monthly (third Friday), 30 days. Defaults: Today + This week.
* Inner **68% band** (1σ) and outer **95% band** (2σ), each can be turned on or off. Fills grow lighter toward the horizon.
* **Price tags** at the band ends show the actual prices, e.g. "Today 1σ 775.20" / "768.26", plus the 2σ pair on the nearest horizon.
 #### Levels: fixed lines, like exposure levels
Anchored to a past close · don't move intraday
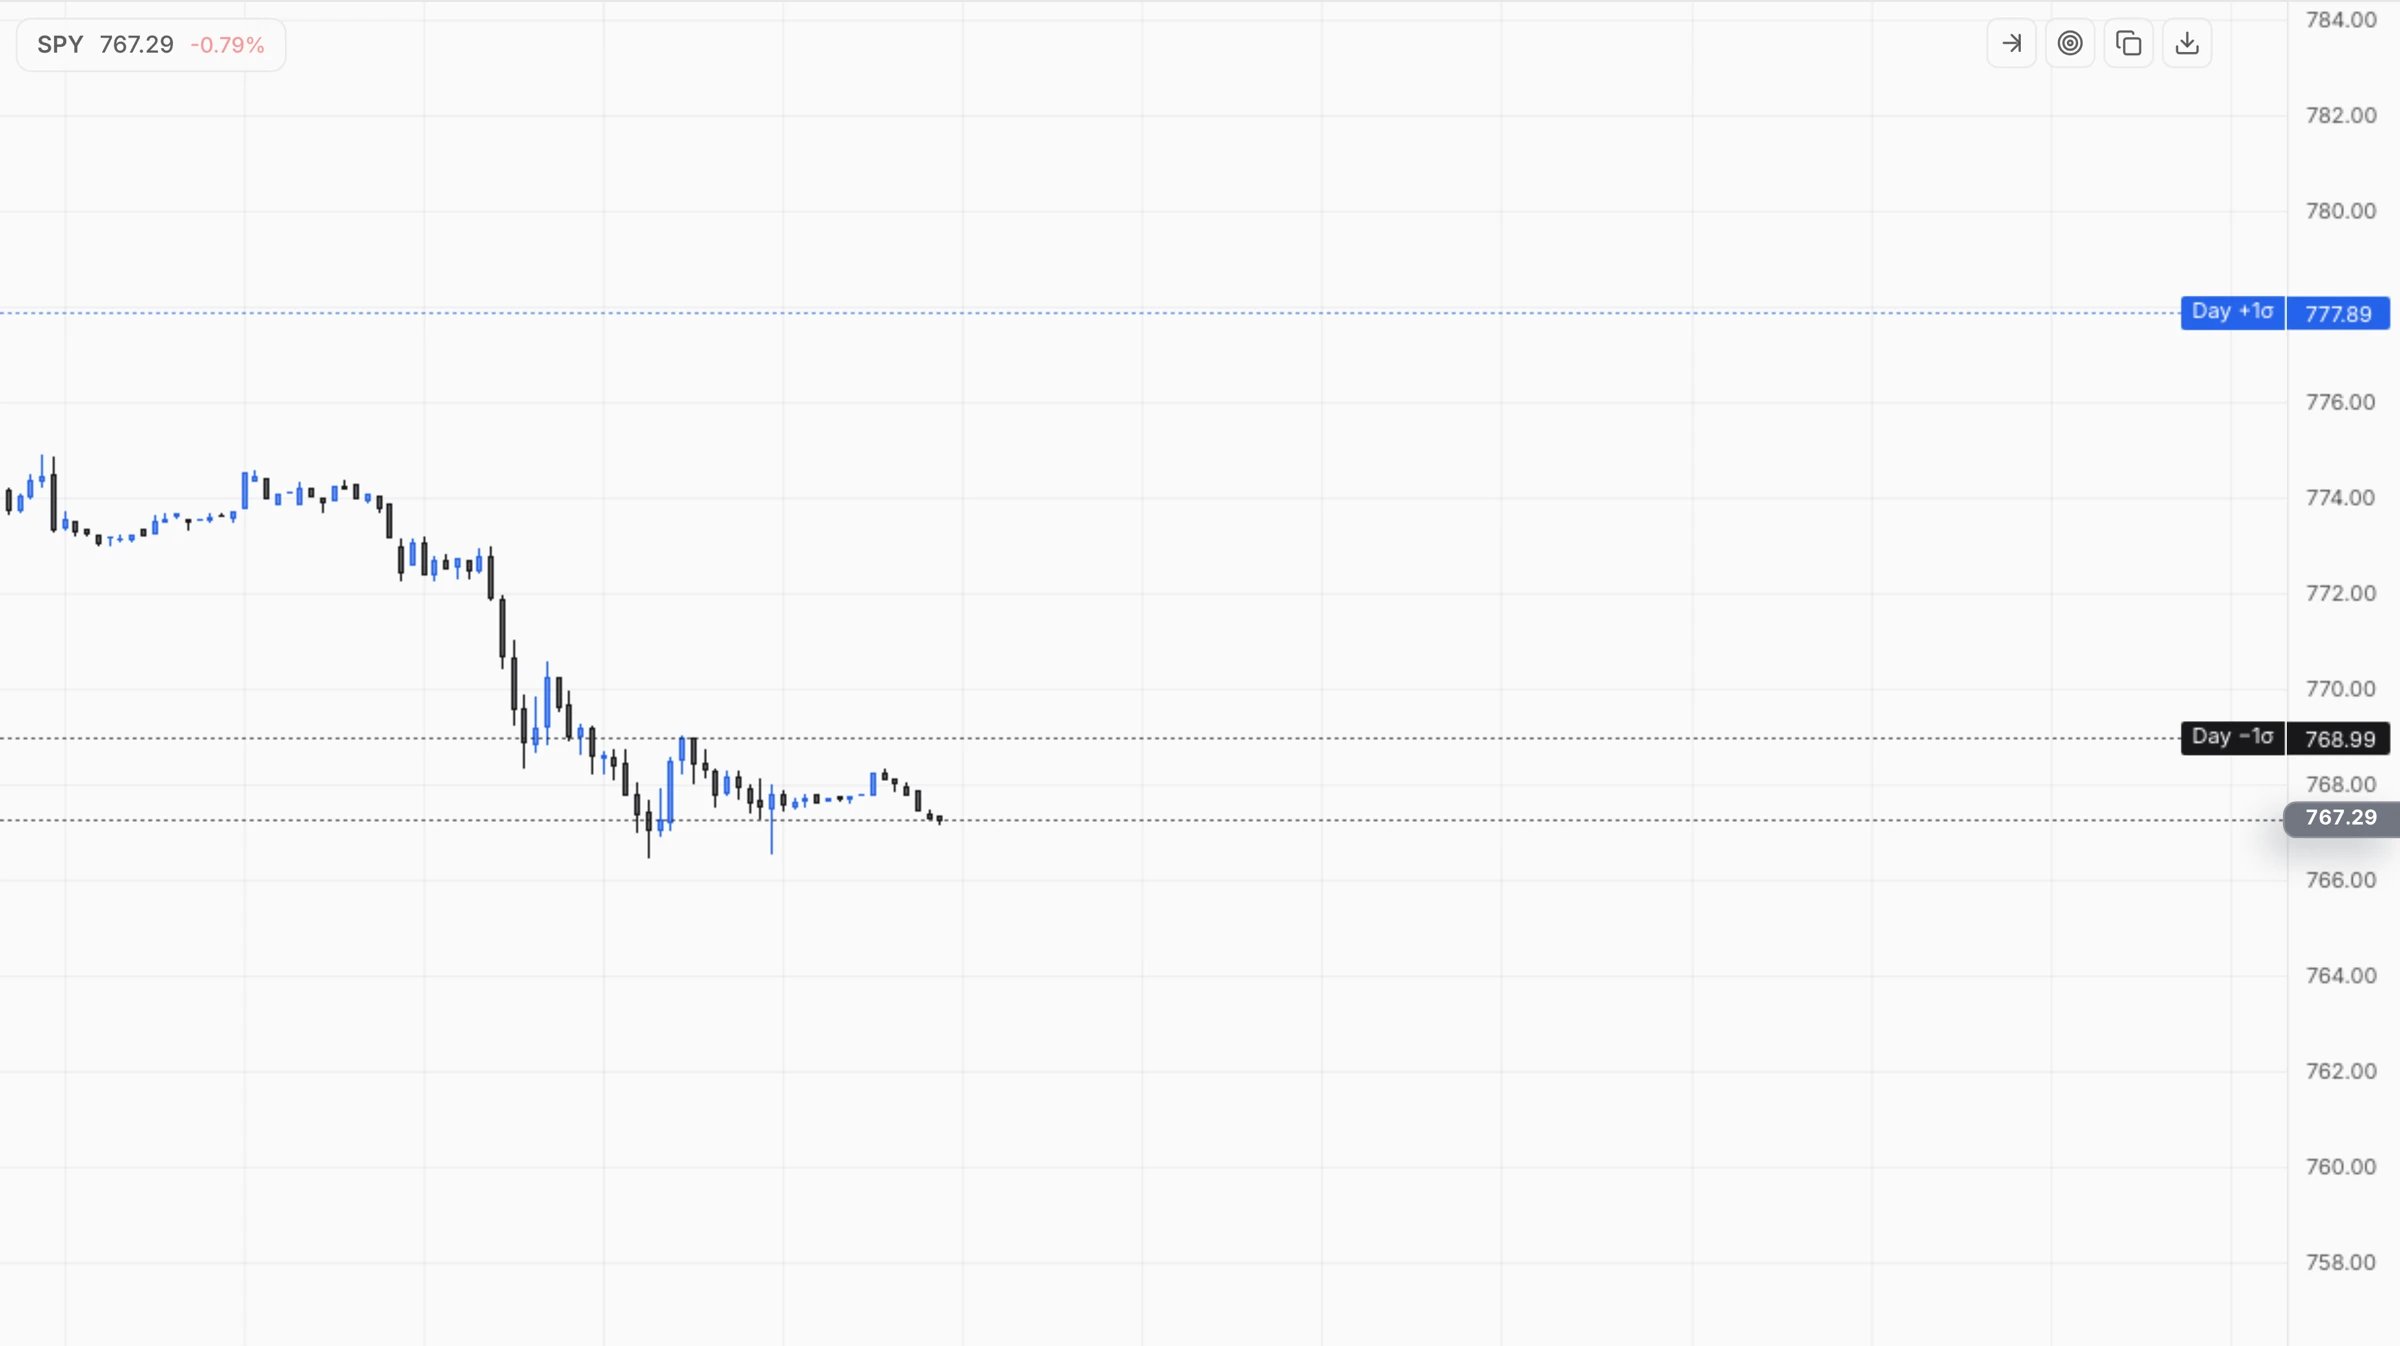
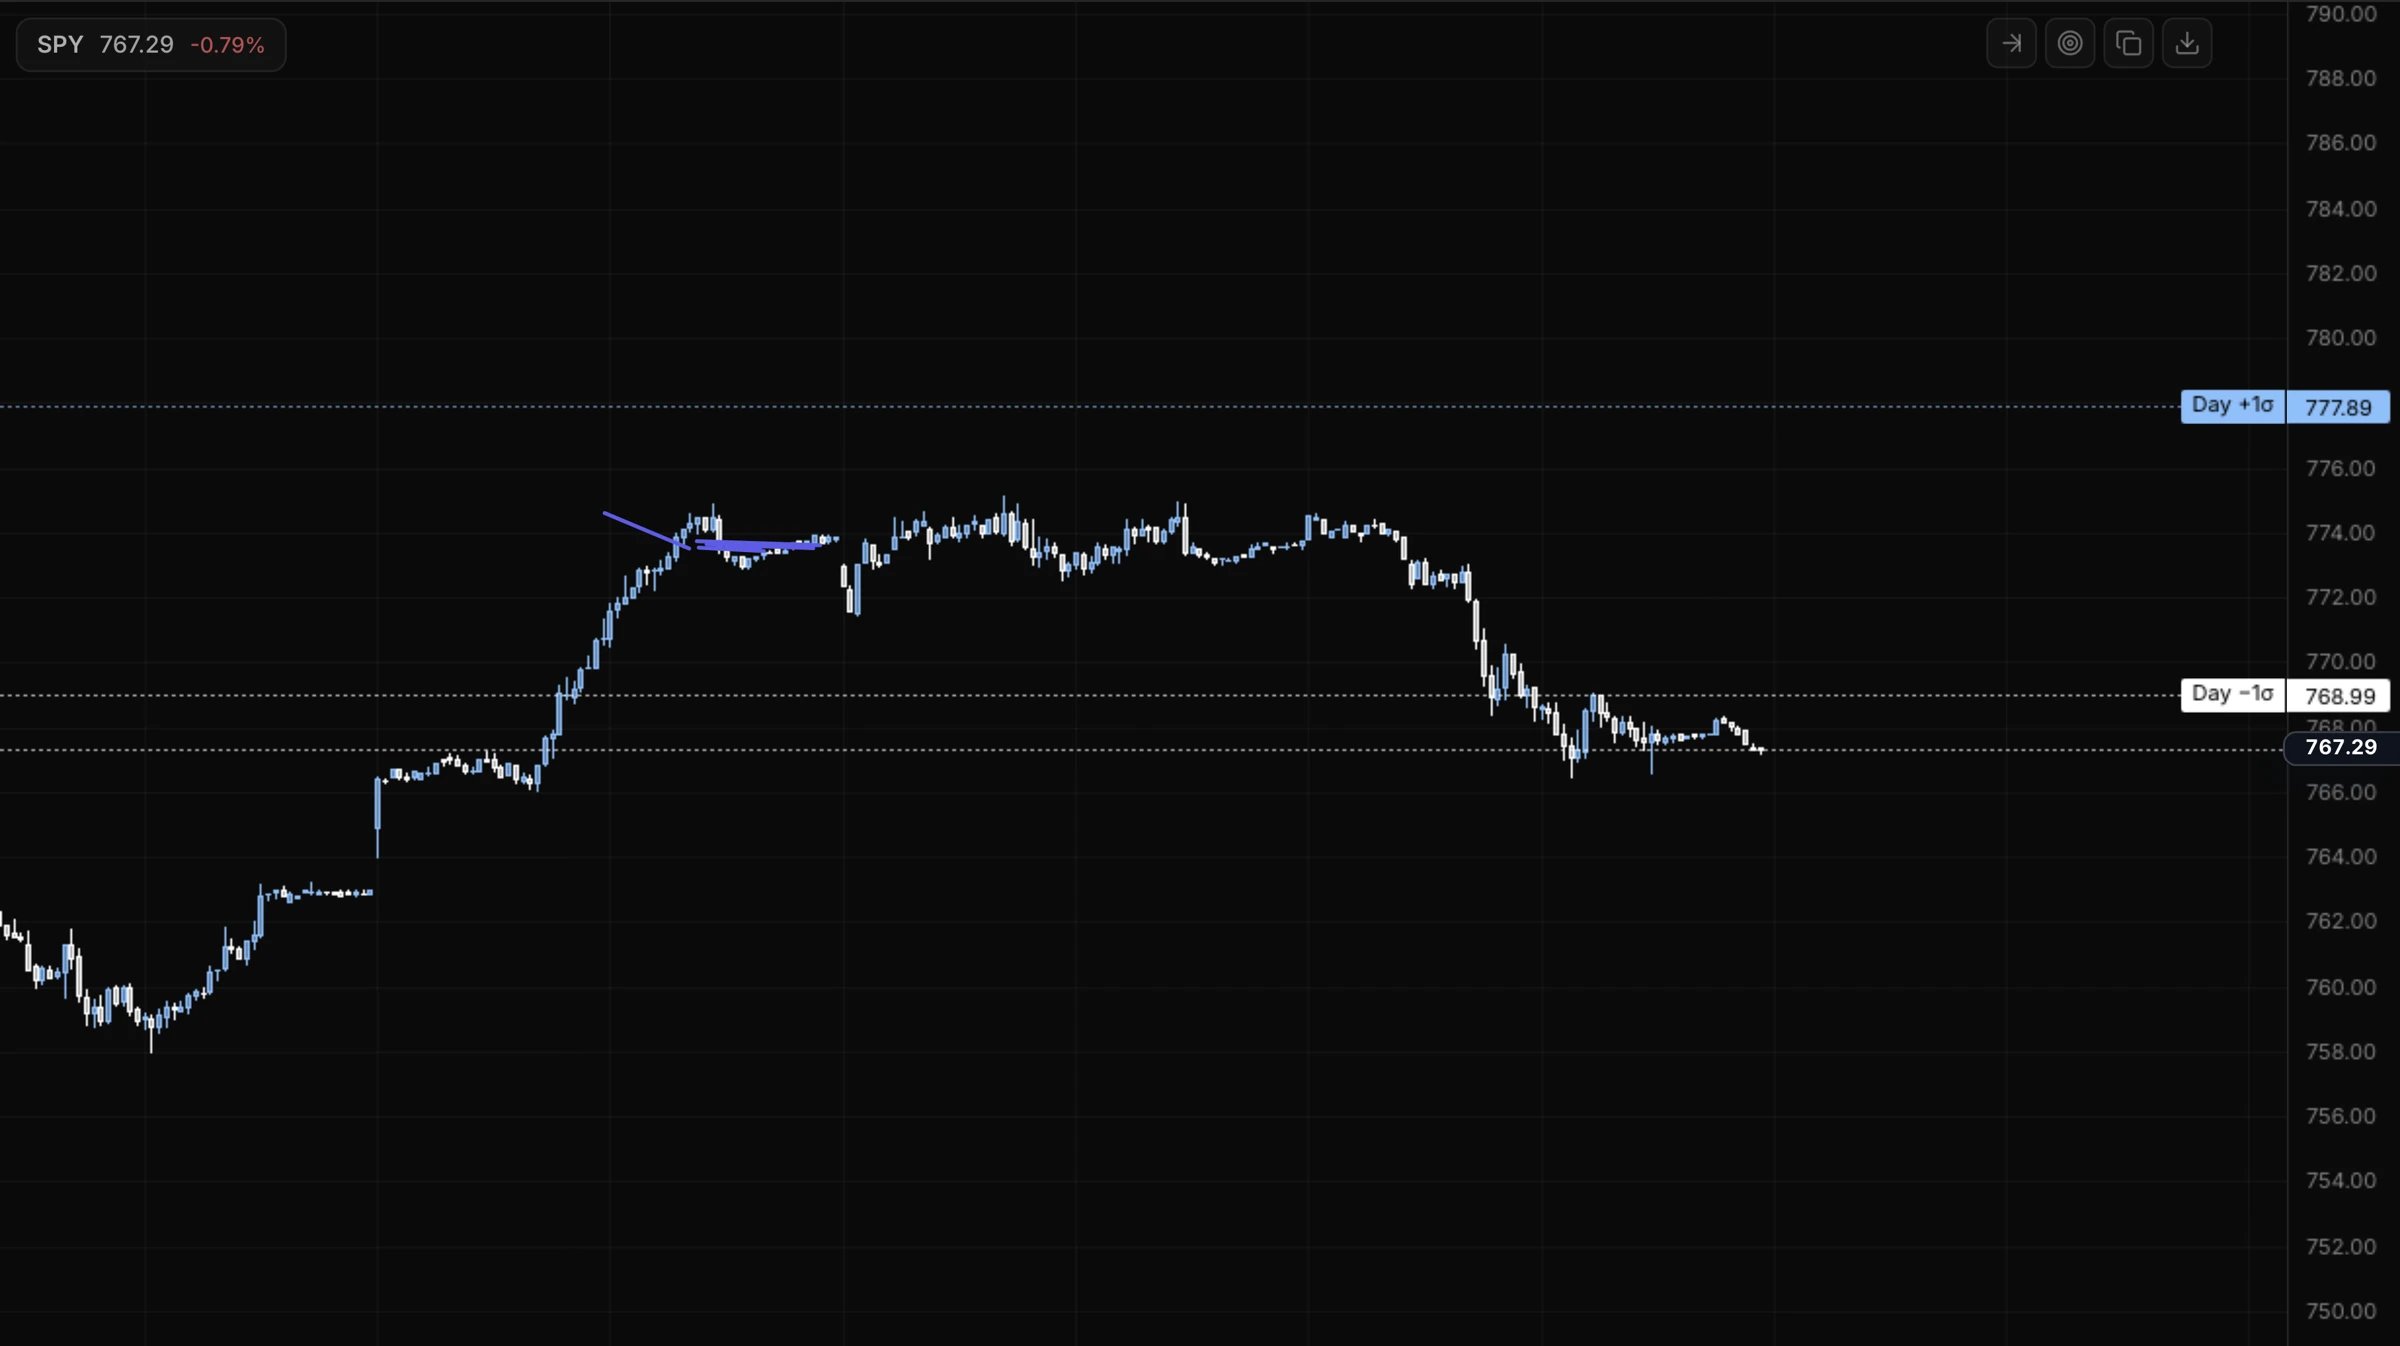
Horizontal price lines at the range options priced at a fixed moment, drawn like Heatseeker's exposure levels and following zoom and pan.
* **Daily range**: today's 1σ range as priced at the prior close.
* **Weekly range**: this week's range as priced at last week's final close.
* **±2σ lines** (optional): the 95% edges of each.
#### Levels: fixed lines, like exposure levels
Anchored to a past close · don't move intraday
Horizontal price lines at the range options priced at a fixed moment, drawn like Heatseeker's exposure levels and following zoom and pan.
* **Daily range**: today's 1σ range as priced at the prior close.
* **Weekly range**: this week's range as priced at last week's final close.
* **±2σ lines** (optional): the 95% edges of each.
 **In Atlas replay** the range levels and the out-of-range note are hidden: they show today's option pricing, which would mislead on past bars. The cone is hidden too, unless you turn on **Cone at replay time** in the Tempest plugin's settings (off by default).
#### Replay and pin: how a cone played out
As priced at the replay time · frozen once pinned
* **Turn it on:** Atlas plugins > **Tempest** > settings > **Cone at replay time** ("pin to score it").
* **In Atlas replay** the cone is the one options priced at the replay time, never a later one, drawn from that moment's price. The panel at the bottom left says when: "as priced at 13:14". Before a session's first reading, or after the close, it is the previous close's cone; **reconstructed** means that close cone was rebuilt from the day's stored history. Today's live cone never appears on past bars.
* **Pin** freezes the cone on screen (in replay or live). As the replay moves on, or new bars arrive, the panel scores it using only bars that had closed by then: the share of closes inside 1σ, where the latest close sits in σ, the furthest move in σ, when price first closed outside 1σ, and when it first reached 2σ. A check mark means that horizon has ended.
* Right after a pin the band is very narrow, so the first bar or two often read as outside 1σ.
* Replays start on Sep 23, 2026 for readings taken during the session; earlier days show the close cones.
**In Atlas replay** the range levels and the out-of-range note are hidden: they show today's option pricing, which would mislead on past bars. The cone is hidden too, unless you turn on **Cone at replay time** in the Tempest plugin's settings (off by default).
#### Replay and pin: how a cone played out
As priced at the replay time · frozen once pinned
* **Turn it on:** Atlas plugins > **Tempest** > settings > **Cone at replay time** ("pin to score it").
* **In Atlas replay** the cone is the one options priced at the replay time, never a later one, drawn from that moment's price. The panel at the bottom left says when: "as priced at 13:14". Before a session's first reading, or after the close, it is the previous close's cone; **reconstructed** means that close cone was rebuilt from the day's stored history. Today's live cone never appears on past bars.
* **Pin** freezes the cone on screen (in replay or live). As the replay moves on, or new bars arrive, the panel scores it using only bars that had closed by then: the share of closes inside 1σ, where the latest close sits in σ, the furthest move in σ, when price first closed outside 1σ, and when it first reached 2σ. A check mark means that horizon has ended.
* Right after a pin the band is very narrow, so the first bar or two often read as outside 1σ.
* Replays start on Sep 23, 2026 for readings taken during the session; earlier days show the close cones.
How traders read them
* **Reversal traders** watch the *levels* as places where a move has already covered what options priced, often next to Heatseeker's walls (see [Heatseeker terms](#pairing-with-heatseeker)). The weekly lines frame multi-day moves.
* **Breakout traders** watch closes through the daily 1σ line, and whether SVX1D is rising with them, as a sign a move is running larger than priced.
* **Option traders** use the *cones* to see where strikes sit against the priced range at a given expiry.
* **Out-of-range note** (on by default): a small neutral tag when price is already outside today's range, so you notice a 1σ+ day without checking Tempest.
Market tab
**Why it matters:** the same reading means something different in a calm market and a stressed one. The Market tab tells you which one you are in before you look at a single stock.
**Where:** Tempest > **Market** tab. The strip across the top of every Tempest page shows the regime, S\&P 30-day, 30d/3m, vol of vol and tail-risk readings at a glance.
Read the **Regime** word first. Then check the rows below for what is driving it.
| Reading | Meaning | A common read |
| ----------------------------------- | ------------------------------------------------------------------------------ | ---------------------------------------------------------------------------------------- |
| Regime | One word: **calm**, **normal**, **elevated**, **stressed**, **crisis** | Context for every other reading. Many traders check it first. |
| S\&P family 1D / 9D / 30D / 3M / 6M | Tempest's VIX-style readings across horizons, drawn as a term curve | 30D tracks Cboe's VIX within about 0.2 pts; 9D and 6M run 0.6 and 1.3 pts low. |
| 30d / 3m ratio · Curve | Near-term vs 3-month; contango / flat / backwardation | Ratio above 1 (backwardation) = acute stress. |
| VIX futures curve · M1→M2 | Where traders price the VIX for coming months; the roll between the first two | A steep positive roll is the calm normal; flat or negative = stress. |
| Vol of vol | How much the 30-day reading itself is expected to swing (a VVIX-style reading) | High vol of vol with a low VIX = traders are paying for the chance of a volatility jump. |
| Tail-risk pricing | Extra paid for crash protection (a Cboe SKEW-style reading) | High = demand for hedges. |
| Crowded calm | Near-term fear unusually low relative to later *and* vol of vol unusually low | Very quiet conditions that leave little cushion if something surprises. |
Skylit Fear & Greed
**Why it matters:** one number for the market's mood, read from what options traders are actually paying, not from headlines or surveys.
**Where:** Tempest > **Market** tab for the gauge and its history. "Fear & Greed 38 · Fear" sits in the strip on every Tempest page. Per stock: add the **Fear/greed** column on the radar (Columns button).
The score runs 0–100. 0 is extreme fear, 100 extreme greed. Bands: under 20 extreme fear, 20–40 fear, 40–60 neutral, 60–80 greed, 80+ extreme greed.
| Component | Fear when… |
| ------------------- | --------------------------------------------------------------------- |
| S\&P vol level | The S\&P 30-day reading is high for the past year |
| S\&P term structure | Near-term fear sits above the 3-month (30d/3m high) |
| Vol of vol | Traders pay up for swings in the VIX itself |
| Tail-risk pricing | Crash protection is expensive |
| Put-skew breadth | Put skew is rich across the stocks Tempest covers, not just the index |
| Rich-vol breadth | A large share of liquid names are in rich vol |
| Down-move breadth | Many names are down 1σ or more today |
The Market tab shows:
* the gauge, with one plain read ("options are pricing more fear than on 63% of the past 6 months")
* the components, sorted so the ones driving the score come first (up to six)
* the score's history
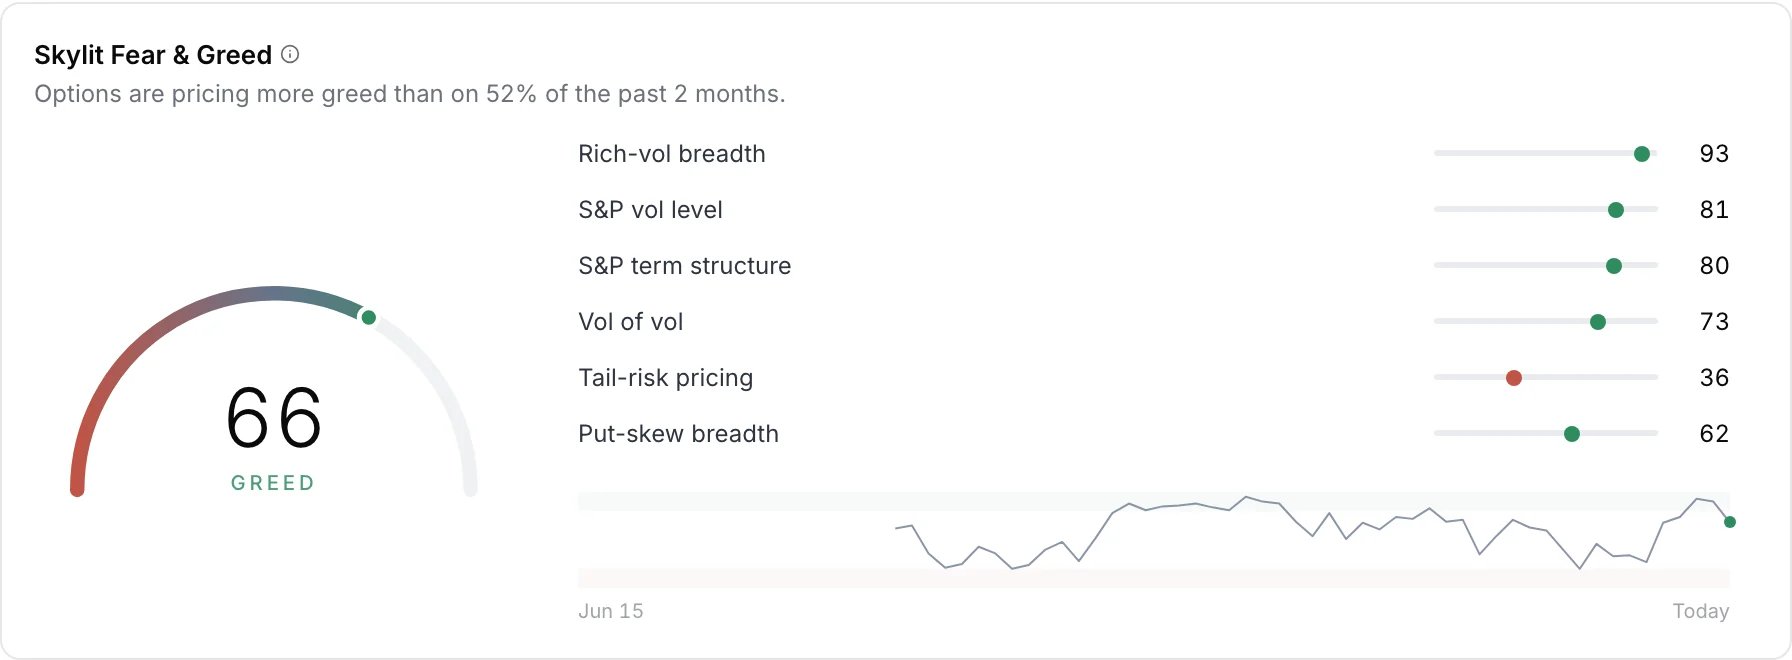
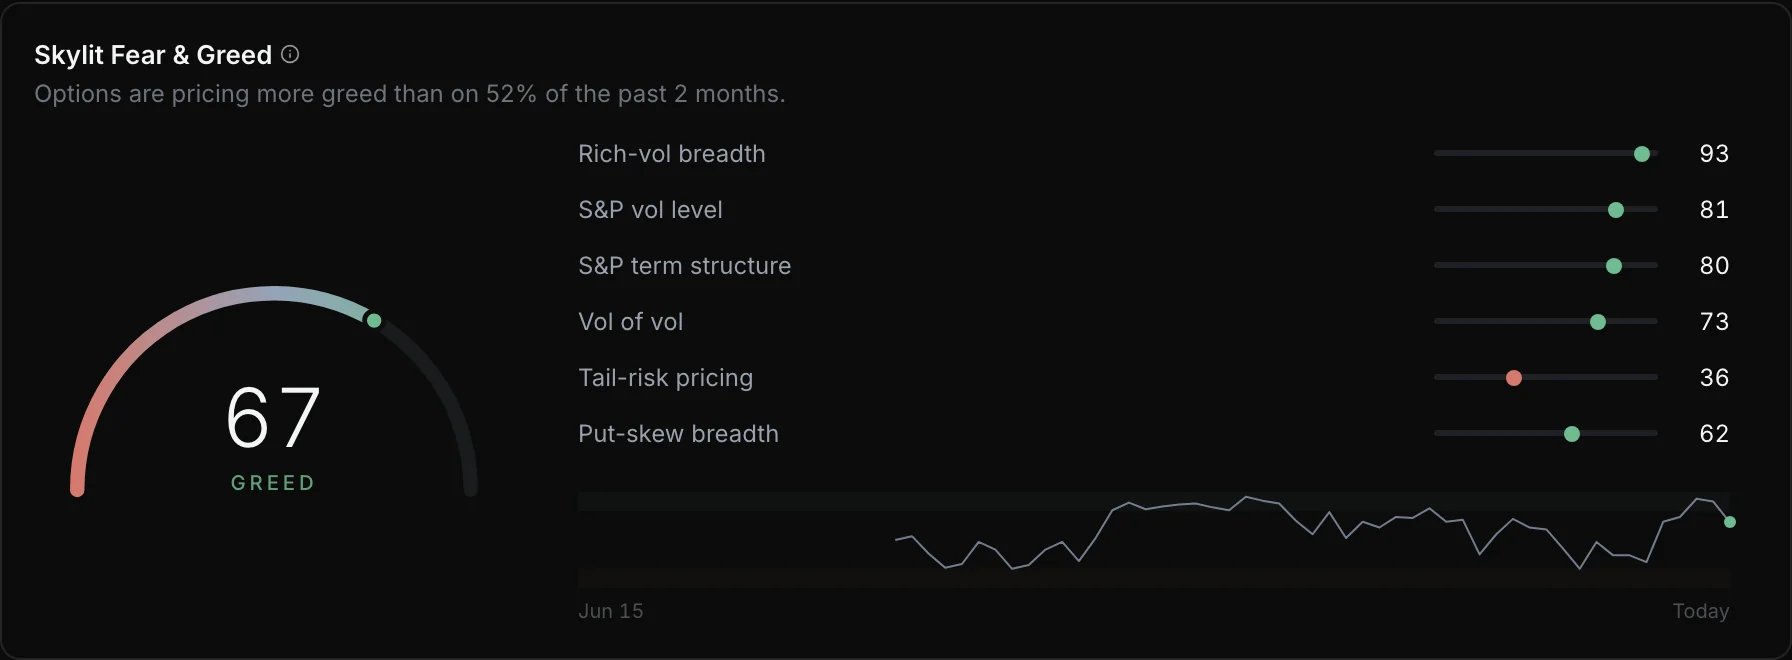 **Per stock:** the radar's optional *Fear/greed* column gives each stock its own 0–100 from its SVX percentile, its skew percentile and its premium imbalance. A stock in fear while the market is neutral is stress specific to that stock. A stock in greed while the market is in fear stands apart from the market in the options market.
How traders read it
* **Extreme fear** comes with expensive protection and rich premium across many names. Reversal traders watch those stretches for signs of capitulation in price, alongside Heatseeker.
* **Premium sellers** note that fear means rich premium, and watch whether the score is still falling or has started to turn.
* **Momentum traders** watch greed with a calm term structure. Extreme greed together with "crowded calm" is widely read as complacency.
These are ways traders read the score, not signals.
Mag 7 dispersion
On the Market tab. It compares the Mag 7's average SVX30 with QQQ's, as a ratio with its percentile. Example: "Mag 7 options price 1.68× the QQQ's move, 22nd %ile". **High**: the big names are priced to move on their own stories. **Low**: they are priced to move together with the index.
Setups: past episodes for this stock
**Why it matters:** one memorable chart can mislead. Setups shows, for this exact stock, how often a condition came before a big move in the past, next to how often big moves happened anyway.
**Where:** Ticker detail > **Setups**, right under the summary. Skew flip and Coiled are also radar presets, with badges on rows and cards.
**Historical, not a forecast.** Setups are descriptive statistics from each stock's own recent history (roughly the past one to two years), measured on that same history. They describe what followed before. They do not predict what the stock will do next, and they are not tested trading signals.
For each stock, Tempest finds the past times it was in a given condition. It reports what followed **for that stock**, always next to a **base rate**. The base rate is how often the same thing happened in any stretch of that length.
1. Open a ticker. Setups sits right under the summary.
2. Find the conditions the stock is in now.
3. Compare each figure with its base rate, and check how many past episodes it rests on.
| Setup | Condition |
| ----------------------------- | ------------------------------------------------------------------------------------------------------ |
| Vol in its cheapest 10% | SVX30 at or below its 10th percentile for the year |
| Vol in its richest 10% | SVX30 at or above its 90th percentile |
| A +2σ / −2σ day | A close-to-close move of 2 expected moves or more |
| Skew flipped to calls | Put-vs-call skew went from puts-rich to calls-rich within 10 sessions |
| Near-term vol above the month | The 9-day reading moved above the 30-day (term inversion) |
| **Coiled** | Skew just flipped to calls *and* sits at its yearly lows, calls are the cheap side, and vol isn't rich |
Each line gives, for the past episodes of that condition: how many there were, the median size of the move over the next 20 sessions, how often that move was up, the largest moves each way, and how often a 2σ day followed within 10 sessions, next to the same figure for any 10-session stretch.
The base rate is the part to read first. It shows whether, in this stock's past, 2σ days came more often after the condition than they did anyway. A gap between the two describes the past; it is not odds for the next episode.
Coiled
Coiled is four conditions at once:
* **Skew just flipped toward calls**: the options crowd has started paying for upside.
* **Skew at its yearly lows**: that flip is extreme for this stock, not noise.
* **Calls are the cheap side** (premium imbalance): calls are priced low relative to puts.
* **Vol not rich**: SVX is not in its rich zone.
It is strict on purpose, so it is rare. Most stocks have no past episodes yet and show "not enough history". Where it has history, its line shows the episode count and the base rate next to it. It appears as a radar preset, a badge on rows and cards, and highlighted at the top of the stock's Setups.
**Read the counts.** A setup with 5 past episodes is a hint, not a statistic. The base rate is there so a figure is read against the stock's own ordinary stretches, not against nothing.
Vol-trader reads
**Why it matters:** these panels compare what options priced with what the stock then did, over its own past. Has this stock moved more or less than priced?
**Where:** all inside the ticker detail.
| Read | Panel |
| ------------------ | ----------------------------- |
| Implied vs actual | Its own panel (starts folded) |
| Spot–vol behaviour | Skew |
| Earnings record | Earnings |
| Forward vol | Term structure |
| Calibrated odds | Expected move |
Implied vs actual
**In plain English.** Implied is the move the options market charges for. Realized is the move the stock actually made. Comparing the two shows whether options have been charging for more movement than the stock delivered, or less.
The chart plots SVX30 against the stock's 20-day realized volatility. Next to it: today's gap, its percentile, and how often implied was above realized over past sessions.
* A wide gap at a high percentile means options are priced well above recent movement.
* A negative gap means realized is above implied: options are behind the stock.
Both describe the past; neither says what the stock will do next.
Spot–vol behaviour
Shown in the Skew section, with the correlation. It is one of three labels:
* **Normal**: vol rises when the stock falls. Most stocks.
* **Call-skew**: vol rises with the stock, a call-skew regime. Seen in meme and squeeze names.
* **Mixed**: neither.
Earnings record
For recent reports, the move priced going in sits next to the move that happened. One line sums it up, e.g. *"the priced move was bigger than the actual move in 6 of 8 reports"*. It describes past reports only.
Forward vol
The vol priced *between* two expirations, e.g. Oct 16 to Nov 20. It is a column in Term structure, with a sentence naming the cheapest and richest window. A rich window often lines up with a scheduled event.
Calibrated odds
In Expected move. An at-the-money option breaks even at expiry on a move of about 0.40σ. For **1 week** and **1 month**, Tempest shows:
* that break-even move, in %
* the **textbook** odds of reaching it (about 34% each way)
* how often **this stock actually got there** over its past year, up (calls) and down (puts), each time against what options priced then
Your broker shows each contract's breakeven and a model probability. This panel shows how often this stock reached that break-even in its own past year. It is history, not the odds for any option you hold.
Patterns traders watch
Traders use Tempest's readings as context next to price, levels and flow. Below is what different kinds of traders commonly look at. These are descriptions, not recommendations. They are not tested signals, and nothing here says what a stock will do.
#### Reversal traders
They watch moves that have already run past what options priced: a 2σ day on the **Sigma event** preset, price at a band edge on Atlas, and the stock's own big-move give-back history in Sigma. Many read those next to Heatseeker's walls. Timing comes from price, not from Tempest.
#### Swing traders
They watch cheap premium: the **Cheap vol**, **Skew flip** and **Coiled** presets. Cheap premium has a catch: SVX is usually low *because* the stock has been quiet, and it can stay quiet. An earnings date inside the window means the premium is not really cheap (check the Earnings panel).
#### Breakout and momentum traders
They watch whether options start pricing a bigger move while price clears a level: SVX1D rising, the term curve moving toward backwardation. They also check the Market tab, because in a stressed market the same breakout reads differently.
#### Premium sellers
They look at how rich premium is for the stock (SVX %ile), whether implied sits above realized, whether an event falls inside the expiry, and how the settling-back history reads. The warning signs they watch: a backwardated term, negative gamma on Heatseeker, and low-priced stocks whose live readings run high (see [Good to know](#good-to-know)).
Around earnings
**Why it matters:** options usually get expensive into a report and cheaper right after. Tempest shows whether this report is priced above or below the stock's usual reaction.
**Where:** ticker detail > **Earnings** (starts folded), and the E markers on SVX history.
* **Priced move vs typical past move:** the Earnings panel shows the 1σ move priced for the report next to the stock's past reactions. Past reactions describe past reports, not this one.
* **SVX1D spikes the night before by design** (E markers on the history chart). Don't read that spike as "rich" on its own.
* **After the report, vol usually drops.** The morning after, premium is often much cheaper than the night before.
Use it with other Skylit tools
**In plain English.** Market makers hedge the options they hold. In positive gamma, that hedging means buying dips and selling rallies, which tends to dampen moves. In negative gamma, they hedge by trading with the move, which tends to speed it up. Heatseeker shows which regime a level sits in.
Tempest shows what the move costs and how big it is priced to be. Heatseeker shows where dealers are positioned.
Heatseeker terms used in this guide:
* **GEX / VEX**: Heatseeker's gamma exposure and vanna exposure views.
* **Positive gamma / negative gamma**: positive and negative nodes on the GEX view.
* **Wall**: a large node, usually acting as a floor or ceiling.
* **Exposure skew**: whether more of the board's exposure sits above price or below it. Heatseeker has no single readout for it. Read it off the board, or ask Talon, which reports it as upside, downside or balanced.
The Heatseeker guide covers these in more depth.
Together:
| Heatseeker shows | Tempest shows | A common read |
| ------------------------------ | ----------------------------------- | ---------------------------------------------------- |
| Positive gamma wall at a level | That level sits near a 1σ band edge | Two separate readings pointing at the same area. |
| Upside exposure skew | SVX %ile low, skew leaning to calls | Upside priced low while positioning leans up. |
| Negative gamma below | Term backwardated, SVX rising | Conditions many traders associate with larger moves. |
| Wall far outside the bands | Low SVX | Options are not pricing a move that far. |
On **Atlas**, the Tempest plugin draws the bands and levels next to your other plugins (see [Expected moves on your chart](#atlas-tempest-cones-levels)). **Talon** can combine Tempest readings with Heatseeker exposure in one question (see [Ask Talon](#talon)).
Ask Talon
**Why it matters:** ask for any Tempest reading in plain English, from any page, without building filters by hand. Talon can also combine Tempest with Heatseeker exposure in one question.
**Where:** open Talon from any page and type your question.
Talon reads the same numbers as the Tempest page. It says when they were taken (after hours, e.g. "readings are from the Sep 22 close") and describes what options are pricing. It does not give trade advice or explain how readings are calculated.
| You want | Ask Talon |
| --------------------------------------- | ----------------------------------------------------------------------------------------------------------------------------------------------------------------------------------------------------- |
| Cheap or rich premium across the market | "Which names have cheap vol right now?" · "Top 10 rich-vol names in semis" |
| A level or a percentile | "Tickers with SVX30 below 20" (the level) · "SVX percentile under 10" (vs each stock's own year). A bare "SVX below 20" is read as the level; Talon says the percentile reading is also available. |
| Combine with Heatseeker exposure | "Cheap vol names with upside exposure skew" · "SVX under 20 and GEX leaning up" · "Rich vol with downside VEX skew" |
| Presets | "Which names just had a skew flip?" · "Show coiled names" · "Premium imbalance where calls are cheap" · "Backwardation" · "Sigma events today" · "Earnings in the next 10 days" · "Rich vs realized" |
| Your own list | "Coiled names on my watchlist" · "Cheap vol on my Swing watchlist" · "Mag 7 by SVX percentile" · "Energy names with put skew extreme" · "NVDA, AMD, AVGO compared" |
| One stock | "Is NVDA's premium rich or cheap?" · "Everything Tempest has on AAPL" · "TSLA implied vs realized" · "AAPL earnings priced move and record" · "QQQ term structure" · "SPY skew and premium imbalance" |
| A day's sigma | "What sigma did SPY close yesterday?" · "QQQ on Sep 21 in sigmas" · "SPY's 2σ days in the last 60 sessions" |
| Expected moves and history | "NVDA expected move this week" · "SPY daily range levels" · "How often did MSFT reach an at-the-money break-even over a month?" |
| Past episodes | "What setups is NVDA in, and what followed before?" |
| The market | "What is the vol regime?" · "Fear & Greed today, and what is driving it?" · "Mag 7 dispersion" |
| Meaning | "What does the skew flip badge mean?" · "What is Coiled?" · "If puts are cheap, does that mean the stock goes up?" |
How it behaves:
* **Heatseeker combinations check every match.** Talon filters Tempest first, then reads Heatseeker exposure for every name that matched. Names without a recent Heatseeker reading are left out, and Talon says how many.
* **Approximate names are left out** unless you ask for them ("include approximate").
* **After the close** everything is the close reading; during market hours it is live.
* **Cheap is not a direction.** Cheap puts mean puts cost less than usual relative to calls; they do not say which way the stock goes. Talon will say so.
Good to know
* **Tempest is in beta.** Readings, panels and names can change during the beta.
* **Tempest describes what options are pricing.** It is not a forecast and not a recommendation. Expensive options can stay expensive, and cheap options on a quiet stock can stay cheap.
* **Low-priced stocks read high during market hours.** For stocks under about \$10, live readings can run noticeably higher than the same stock's after-close reading, so they can look richer than they are. For stocks under about \$25, lean on the after-close readings.
* **"Approximate" means rough.** Names with too few quotes, or a very low share price, are marked *Approximate*. The radar hides them by default. Read them as a rough guide.
* **Short history means provisional percentiles.** Under about 60 sessions of history, treat a stock's percentiles as provisional.
* **Setups, settling-back history, calibrated odds and percentiles describe each stock's own past**, roughly the last one to two years, measured on that same history. They show what happened before, not what will happen next. Small counts (a handful of past episodes) are hints.
* **The S\&P 9-day and 6-month readings run a little low** next to Cboe's (about 0.6 and 1.3 pts). The 30-day tracks the VIX closely.
* **Fear & Greed's history uses fewer ingredients than today's score.** The live score uses all seven components; the history line uses the four index components only.
* **Expected-move bands have run a little wide**, which is normal when options carry a premium over the moves that follow.
* **The patterns in this guide describe what traders watch.** They are not recommendations and not tested signals.
* **Not in Tempest yet:** alerts on volatility events, options flow combined with volatility, and skew history by delta.
What's new
**September 2026**
* **Replay and pin Tempest cones on Atlas.** Turn on Cone at replay time in the Tempest plugin's settings to see, in Atlas replay, the cone options priced at that moment. Pin a cone and a scorecard tracks price against it. See [Expected moves on your chart](#atlas-tempest-cones-levels).
* **Weekend-adjusted SVX.** Percentiles, setups, the usual range and SVX history use a weekend-adjusted reading, so Fridays stop looking cheap. A Weekend-adjusted checkbox on the history chart shows the standard reading. See [Weekend-adjusted readings](#weekend-adjusted-readings).
* **Why some names aren't on the radar.** Tap or hover the name count above the radar to see where the rest are. Search a name that isn't on the radar and it opens with a short note saying why. See [Why the radar shows fewer names than Tempest covers](#why-the-radar-shows-fewer-names-than-tempest-covers).
* **Tempest in Talon.** Ask Talon about cheap or rich names, presets, one ticker, a day's sigma or the market regime, even combined with Heatseeker exposure skew. See [Ask Talon](#talon).
* **Resizable radar and detail panes.** On desktop, drag the divider to resize the radar and ticker detail; the toolbar no longer covers them. Dealer levels moved to Heatseeker. See [Read one stock: ticker detail](#ticker-detail-section-by-section).
* **Setups and the Coiled preset.** Each ticker shows what followed past times in the same condition, next to a base rate. Skew flip and Coiled join the presets. See [Setups: past episodes for this stock](#setups-what-happened-next).
* **Implied vs actual, earnings record and calibrated odds.** Ticker detail adds implied vs actual vol, spot-vol behaviour, earnings record, forward vol and calibrated odds. Panels fold and stay how you left them. See [Vol-trader reads](#vol-trader-reads).
* **Skylit Fear & Greed and Mag 7 dispersion.** The Market tab adds a Fear & Greed gauge built from options pricing, plus Mag 7 dispersion. The score also sits atop every Tempest page. See [Skylit Fear & Greed](#skylit-fear-greed).
* **A clearer Sigma panel.** You see moves in dollars, the last big move, whether the stock breaks its range more than priced, and a tappable 60-session strip. See [Sigma](#sigma).
* **Tempest on your phone.** On a phone the radar becomes cards with a filter sheet, and ticker detail gets a pinned header with section tabs. See [Where to find it](#where-everything-lives).
* **Premium imbalance preset fixed.** The Premium imbalance preset had shown few or no names, especially after the close. Heavily traded names such as QQQ and AAPL now appear. See [Two guards against false readings](#two-guards-against-false-readings).
* **Longer SVX history with a usual range.** SVX history reaches back up to five years, with a usual-range band and optional skew line. Settling back shows how often similar readings normalized. See [SVX history](#svx-history).
* **Sector and theme groups on the radar.** Group the radar by sector or theme to see which groups are rich or cheap together, and pick the horizon and lookback that rank it. See [Rank the market: the radar](#radar-columns-presets).
* **Daily and weekly range levels on Atlas.** The Atlas Tempest plugin can draw fixed daily and weekly range lines: today's range priced at the prior close, and this week's priced at last week's close. See [Expected moves on your chart](#atlas-tempest-cones-levels).
* **Market tab.** The new Market tab shows S\&P 500 volatility: regime, term curve, VIX futures, vol of vol and tail risk. Tickers gain Skew and Earnings. See [Market tab](#market-tab).
Glossary
Every term as the app defines it.
Terms as they appear in the app (71 terms).
| Term | Meaning |
| ------------------------------ | ---------------------------------------------------------------------------------------------------------------------------------------------------------------------------------------------------------------------------------------------------------------------------------------------------------------------------------------------------------------------------------------------------------------------------------------------------------------------------------------------------- |
| **1y range** | The lowest and highest SVX30 over the past year. Puts today's reading in context: near the bottom of the range, options are about as cheap as they have been all year. |
| **2σ day within 10 sessions** | How often a day of at least two expected moves followed within 10 sessions of the setup, next to how often that happens in any 10 sessions for this stock. The gap between the two numbers is what the setup added; without the second number the first can look more special than it is. |
| **2σ move** | Twice the expected move. Moves this large happen on only about 5% of days. A useful outer boundary for what would count as a very unusual move. |
| **30d / 3m ratio** | The 30-day reading divided by the 3-month reading. Below 1 means near-term fear is lower than later. It is the quickest way to tell a calm market (well below 1) from a stressed one (above 1). |
| **Approximate** | Approximate: at this share price, the smallest option price increments make readings coarse. Small moves in option prices show up as big jumps in the numbers, so read them as rough. |
| **Big-move give-back** | After days that moved 1.5σ or more, how often the price gave back at least half of that move within a week. It shows whether big days for this stock have tended to stick or fade. |
| **Budget left** | How much more movement, in percent, options are still pricing between now and today's close. The remaining expected move shrinks as the day goes on, so a big move late in the session stands out more. |
| **Calibrated odds** | An at-the-money option breaks even on about a 0.40σ move. This shows the textbook odds of that next to how often this stock actually moved that far, up and down, over its past year. Textbook odds treat every stock the same; this stock's own record shows whether its moves have tended to run past or fall short of what options priced. |
| **Cheap side** | Which side, calls or puts just out of the money, is priced lower than usual relative to the other. An unusual imbalance shows which way the market is leaning. |
| **Coiled** | Skew has just flipped to calls and sits near its lows for this stock, calls are cheap next to puts, and volatility is not expensive. It is a quiet, low-priced stretch that on some stocks has come before large moves; the history shows how often that held here. |
| **Crowded calm** | Near-term fear is unusually low relative to later AND volatility of volatility is unusually low. Very quiet conditions leave little cushion, so a surprise can move volatility sharply. |
| **Curve** | Whether near-term volatility sits below (contango), level with (flat) or above (backwardation) longer-term volatility. Contango is the normal calm state; backwardation shows up when fear is high right now. |
| **Data quality** | Fewer quotes than usual right now, so treat this as approximate. Numbers built on less trading are less reliable and can jump around. |
| **DTE** | Days until this expiration date. Nearer dates react faster to news; farther dates reflect longer-term expectations. |
| **Earnings in** | Calendar days until the next earnings report. Option prices usually rise into earnings and drop right after. |
| **Expected move** | The size of move, up or down, the options market is pricing for this stock over the period shown. About 68% of the time the actual move ends up smaller. It turns volatility into a price range you can picture on a chart. |
| **Fear/greed** | The same 0-100 mood reading for one stock, from its own options: how pricey they are against its past, how much protection is in demand, and which side's premiums are richer. Low means its options lean fearful for this stock; high means they lean relaxed or eager. |
| **Forward vol** | The volatility options price for just the stretch between one expiration and the next, as a yearly percentage. It shows which weeks ahead the market expects to be calm or busy — an earnings date usually makes its window the richest. |
| **From low** | How far this option's price is above its lowest price since it started trading, in percent. Near 0% means it is at or close to its cheapest level so far. |
| **Implied beat actual** | How often, on past sessions, the move options priced for the next 20 sessions was larger than the move that actually followed. It shows whether options on this stock have usually been priced above or below what the stock went on to do. |
| **Implied vol (full smile) %** | The options market's estimate of yearly movement for this one expiration date, read across all option prices, which runs a little above the at-the-money figure brokers show. Lining up expiration dates shows which periods the market expects to be calm and which turbulent. |
| **Implied vs actual** | SVX30 (what options price for the next month) next to how much the stock has actually moved over the last 20 sessions, both as yearly percentages. When implied sits well above actual, options are pricing more movement than the stock has been delivering. |
| **IV rank 1y** | Where today's SVX30 sits between the past year's lowest reading (0) and highest reading (100). It shows how close today is to the year's extremes; one past spike can make it read low even when volatility is elevated. |
| **Leg price** | The price of the nearest out-of-the-money option on that side, and the price level it pays off beyond. These are the two options the imbalance compares. |
| **Liquidity** | Whether these options trade enough, with tight enough prices, for the numbers to be dependable. Imbalances in rarely traded options are often just stale prices. |
| **M1→M2** | How much the second VIX futures month is priced above the first, in percent. A steep positive gap is the calm normal; a negative one means near-term fear is priced above later fear. |
| **Mag 7 dispersion** | How big a move options price for the Mag 7 names on average, compared with the move priced for the QQQ as a whole. High means the big names are expected to move on their own stories (a stock-picking market); low means they are expected to move together (an index market). |
| **Odds** | How often moves this big happen: the textbook bell-curve figure next to how often they actually happened for this stock. Real stocks have more big days than the textbook says; the second number shows by how much. |
| **Priced for today** | The move, up or down, options priced at the prior close for today's session, as a percent of the price. Sigma measures today's move against exactly this figure. |
| **Priced move (1σ)** | The one-sigma move, up or down, options are pricing for the day of the next earnings report. It shows how big a reaction the market is bracing for. Brokers' "expected move" figures (from the at-the-money straddle) run about 20% smaller. |
| **Priced vs actual** | For each past report: the move options priced going in, next to the move the stock actually made. It shows whether this stock has usually moved less or more than its earnings were priced for. |
| **Pricier than what followed** | How often, over the past year, options priced more movement than the stock then delivered. It shows whether options on this stock have usually been expensive or cheap in hindsight. |
| **Put/call price** | The price of the nearest out-of-the-money put divided by the nearest out-of-the-money call. Above 1 means downside protection costs more than upside exposure at the nearest levels. |
| **Realized %** | Recent actual moves: how much the stock has really been moving lately, scaled to the same period. Comparing it with the expected move shows whether options are pricing more or less movement than the stock has actually delivered. |
| **Regime** | A one-word summary of the S\&P 500's volatility mood: calm, normal, elevated, stressed or crisis. Most readings on this page mean something different in a calm market than in a stressed one. |
| **S\&P 3-month** | The same estimate for the S\&P 500 over the next 3 months. It tracks Cboe's VIX3M within about 0.2 pts. Comparing it with the 30-day reading shows whether fear is concentrated right now or spread out. |
| **S\&P 30-day** | The options market's estimate of how much the S\&P 500 will move over the next month, as a yearly percentage: our VIX-style reading, which tracks Cboe's VIX within about 0.2 pts on a typical day. 30 ≈ the S\&P 500 priced for about ±1.9% a day. It's the size of the expected swing in the S\&P 500, up or down — not a forecast of direction. About 68% of the time the index is expected to stay inside that range. |
| **S\&P 6-month** | The same estimate for the S\&P 500 over the next 6 months. It runs about 1.3 pts below Cboe's VIX6M. The slowest-moving reading; it reflects the market's long-run comfort level. |
| **S\&P 9-day** | The same estimate for the S\&P 500 over the next 9 days. It runs about 0.6 pts below Cboe's VIX9D. When it sits above the 30-day reading, the market is more worried about the next week than the month. |
| **S\&P next-day** | Implied vol for roughly the next 24 hours from S\&P 500 options. Cboe's VIX1D measures the rest of the current trading day, so the two differ. It jumps ahead of known events such as a Fed decision or a jobs report. |
| **Same-distance ratio** | The same put/call price ratio, but with both sides the same distance from the current price. It removes the accident of where the nearest levels happen to sit, so the comparison is fair. |
| **Settling back** | Where today's SVX30 sits against this stock's usual range, and, when it was this high or this low before, how often it was back at its usual level within a month and how long that typically took. High volatility tends to fade; this shows how quickly it has for this stock. |
| **Setups** | Conditions this stock has been in before — cheap or rich volatility, 2σ days, skew flipping to calls — and what the stock did in the weeks after each past time. It puts today in the context of this stock's own past, next to how often the same thing happens on any ordinary stretch. |
| **Sigma** | Today's move so far, measured in expected moves (σ) priced at yesterday's close. +1σ means the stock is up exactly one expected move. It separates ordinary days (under 1σ, about 68% of days) from unusual ones (over 2σ, about 5% of days), however volatile the stock normally is. |
| **Skew %ile 1y** | How today's skew compares with the past year: 90 means puts are richer versus calls than on 90% of days. It tells you whether demand for protection is unusual for this particular stock. |
| **Skew 30d** | How much more (positive) or less (negative) protective puts cost than comparable calls over the next month, in volatility points. Positive and rising means investors are paying up for protection against a drop. |
| **Skew flip** | Within the last 10 sessions, calls went from cheaper than puts to as rich as or richer than puts. A turn in which side of the options market is in demand often marks a change in mood for the stock. |
| **Skylit Fear & Greed** | One 0-100 reading of the market's mood, built from what options are pricing, not headlines: 0 is extreme fear, 50 neutral, 100 extreme greed. Fear shows up in option prices first: protection gets expensive and swings get priced bigger. This puts all of that on one dial. |
| **Smile** | Option prices across price levels for the roughly 1-month expiration, shown as implied volatility, next to their expected shape. Levels priced well above the expected shape are where traders are paying extra. |
| **Spot** | The stock's latest price. Dollar expected moves are measured from this price. |
| **Spot–vol link** | Whether SVX30 has tended to rise when the stock falls (the usual pattern) or rise when the stock rises, over the last 60 sessions. The link runs from −1 to +1. When volatility rises with the price, rallies can feed on themselves — a pattern seen around short squeezes. |
| **Straddle-implied 1σ %** | The one-sigma move implied by at-the-money options, as a percent of the stock price. A second read on the same expected move; when the two agree, the estimate is on firmer ground. |
| **SVX %ile** | How today's reading for the chosen horizon compares with the same stock over the chosen lookback: 90 means higher than on 90% of days. Pick the horizon that matches how long you hold a position, and the lookback that matches how far back you want to compare. |
| **SVX %ile 1y** | How today's SVX30 compares with the past year: 90 means it is higher than on 90% of days. It tells you whether options are expensive or cheap for this particular stock, which the raw number alone cannot. |
| **SVX / S\&P** | This stock's SVX30 divided by the S\&P 500's 30-day reading, the market-wide fear gauge. 2.0 means options price this stock to move twice as much as the S\&P 500. It shows how much more (or less) jumpy this stock is expected to be than the overall market right now. |
| **SVX1D** | The same estimate for just the next trading day, stated as a yearly percentage so it lines up with SVX30. Hover it to see the move options price for the next session, in percent. When it sits well above SVX30, the market expects an unusually big move very soon, often around news or earnings. |
| **SVX30** | SVX (Skylit Volatility Index): how much the options market expects this stock to move over the next month, as a yearly %. Think of it like the VIX, for each stock. SVX 30 ≈ options pricing about ±1.9% on a typical day. Higher means bigger expected swings and pricier options. It's the size of the expected swing in the stock's price, up or down — not a forecast of direction, and not a change in the index itself. About 68% of the time the price is expected to stay inside that range. |
| **SVX3M** | The same estimate over the next 3 months, as a yearly percentage. 30 means roughly ±8.7% a month. Longer readings change slowly and show the market's baseline expectation for this stock. |
| **SVX6M** | The same estimate over the next 6 months, as a yearly percentage. The slowest-moving reading; a jump here means the market has changed its long-run view of the stock. |
| **SVX9** | The same estimate over about the next two weeks, as a yearly percentage. 30 means roughly ±4.2% over a week. Comparing short and long readings shows whether traders expect turbulence now or later. |
| **Tail-risk pricing** | How much extra investors pay for protection against a sudden large S\&P 500 drop. It tracks Cboe's SKEW within about 2 pts. A high reading means crash protection is in demand, even when the 30-day reading looks calm. |
| **Term 9-30** | The 9-day reading minus the 30-day reading. Above zero means the market expects more movement in the next week or so than over the month. Above zero (called backwardation) usually shows up around stress or an upcoming event; below zero is the normal, calm state. |
| **Thin** | Fewer quotes than usual right now, so treat this as approximate. Numbers built on less trading are less reliable and can jump around. |
| **Tilt** | How lopsided put and call prices are after allowing for the normal difference between them, in volatility points. Positive = puts rich, calls cheap. Normal skew is expected; tilt shows only the unusual part. |
| **Tilt vs history** | How today's tilt compares with this stock's own past year, as a percentile. An extreme reading is rare for this stock, which is what makes it noteworthy. |
| **Typical past move** | The middle-sized stock move after recent earnings reports, up or down. Comparing it with the priced move shows whether the market expects more or less drama than usual. |
| **VIX futures curve** | Where traders are pricing the VIX for each coming month. An upward slope is the normal calm state; a downward slope means the market expects today's fear to fade. |
| **Vol of vol** | How much the S\&P 500's 30-day reading is itself expected to swing. It tracks Cboe's VVIX within about 0.6 pts. High readings mean traders expect fear to change quickly; very low readings can mean complacency. |
| **VRP** | How much higher the options market's volatility estimate is than the stock's recent actual volatility, in volatility points. A large positive gap means options are priced well above what the stock has been delivering. |
| **vs sector** | How much pricier (+) or cheaper (−) this stock's options are than its sector's today, in percentile points. Big gaps flag stock-specific stories. |
| **vs usual** | How today's imbalance compares with this stock's own past, as a percentile; "new" while there is not enough history. An extreme reading is rare for this stock, which is what makes it noteworthy. |