Introduction:
This is a guide on how to spot potential higher timeframe trend shifts on the indices. We’ll be looking primarily at the VEX positioning rather than the GEX positioning, as it is a reliable source for determining where dealers will be positioned in the sessions ahead.Bearish Positioning for the Week of 11/7/2025:
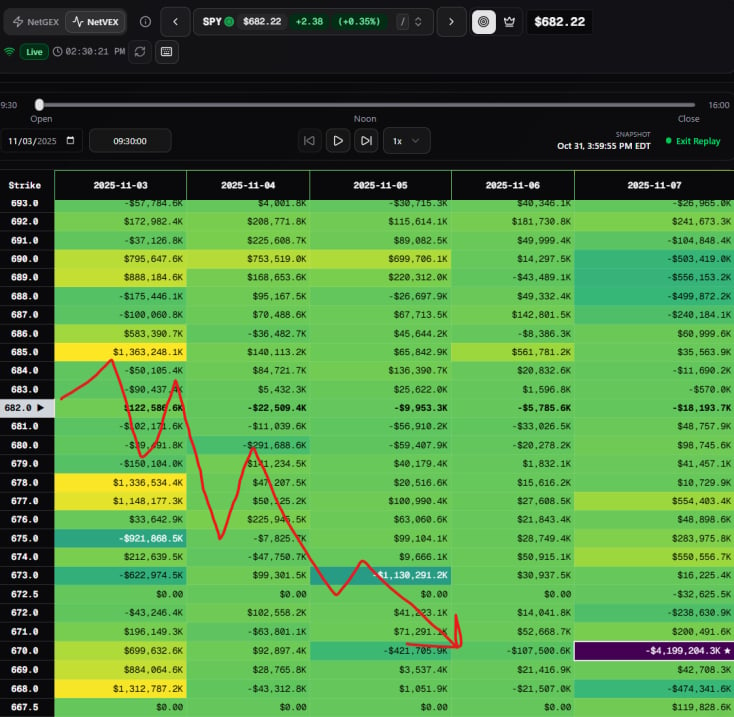
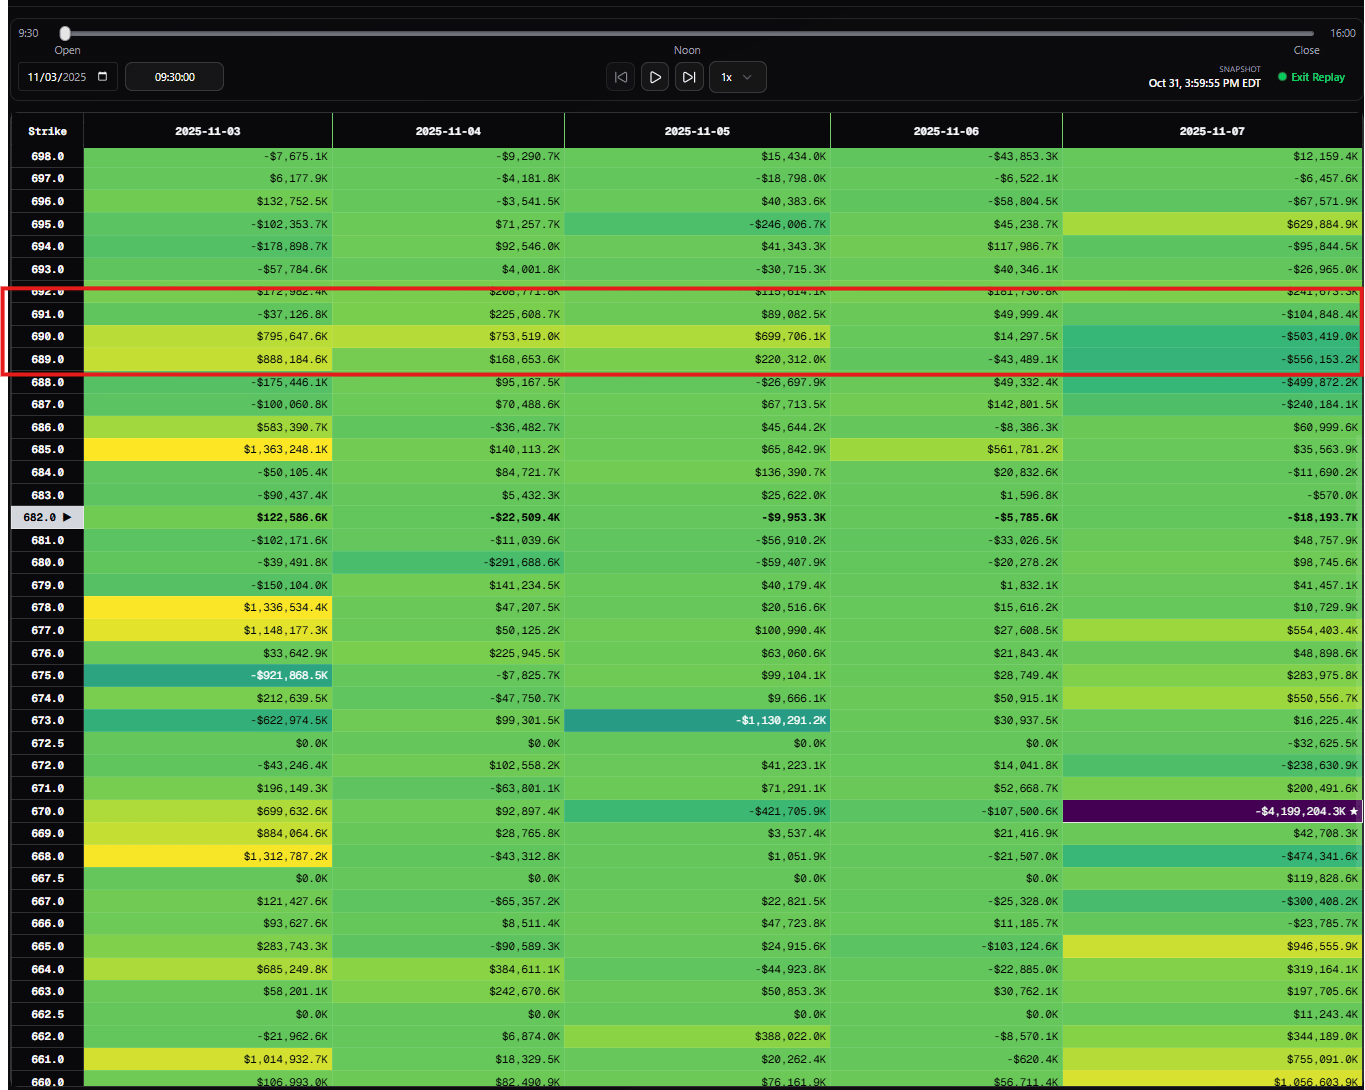
- VEX was looking toppy on SPY and QQQ. We can determine this because of a lack of accumulation to the upside nodes.
-
685 SPY was a strong gatekeeper node with very minimal upside accumulation at 690. With price having been delivered from 690 a few days ago, I found the probability of us going back up to 690 was low.
-
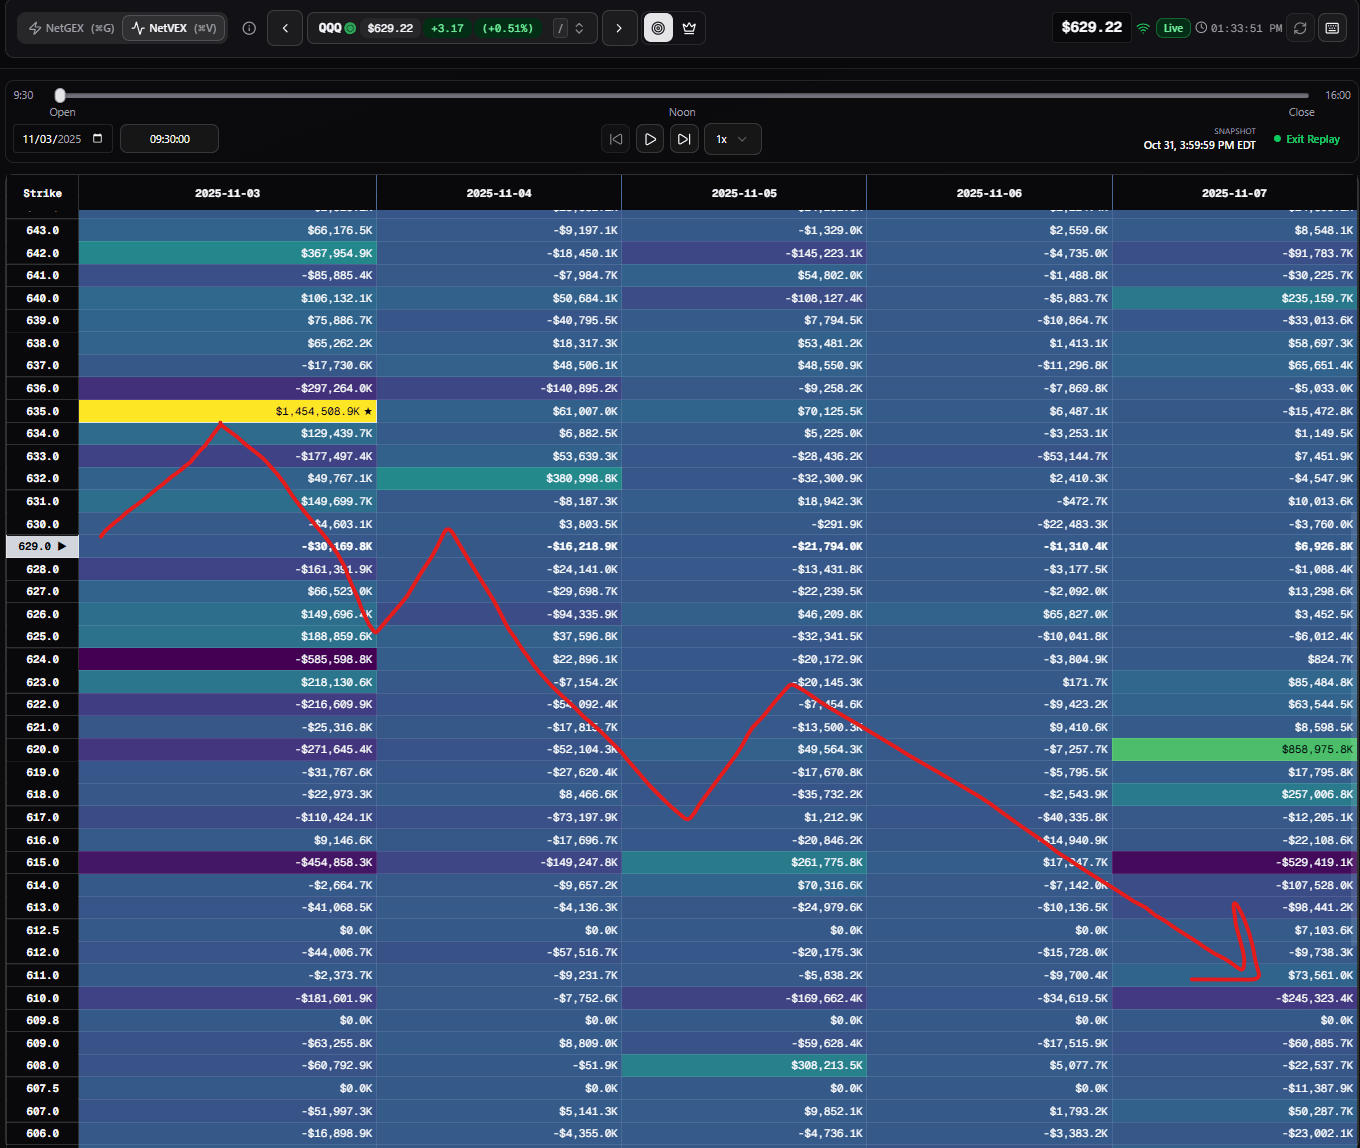
QQQ had a similar outlook as SPY, with a king node at 635 and high accumulation into the next few days. Similar to SPY, we observed that same stair-stepping pattern. This is a significant confluence to consider.
How to trade this bearish bias:
Though VEX positioning shows how dealers are postured in the days ahead, the strategy of trading this positioning is relatively straightforward: by playing node rejections with the knowledge that dealers are postured in an extremely bearish manner. Keep in mind that maps can shuffle at a moment’s notice, whether that’s intraday or for the days ahead. An invalidation of this bias would simply be the opposite of how it was formed: higher accumulation at higher strikes, dissipation of values at lower strikes, and stronger positioning closer to the money.Outcome:
As the heatmaps indicated, SPY sold all the way down to 661, with QQQ tapping its weekly low at 598, a nearly 3% move from peak to trough.Quiz:
- What is a valid piece of criteria in identifying how market dealers are positioned?
- An analyst report claiming that the indices are due for a pullback.
- $5m in put options being bought on SPY
- Stairstep VEX exposure to the downside, with comparatively little accumulation to the upside.
- Your fib levels show that the market is overextended.
Answer:
Answer:
C. Dealer positioning is expressed through the Greeks.