

This page covers product guidance for Atlas: what the feature is, how the main settings work, and what users should understand before configuring it. The Atlas Academy module inside Skylit Terminal covers deeper applied walkthroughs and examples.
Atlas in the Skylit ecosystem
Atlas acts as a visual hub inside Skylit Terminal. As the platform evolved, Heatseeker, Flowseeker, Agenthub, and Nexus have been integrated directly into charts so users can review relevant data while price action is developing.- Heatseeker helps identify dealer-positioning levels.
- Dark Pool levels help surface areas where large hidden activity may be present.
- Flowseeker helps show where options activity is coming in.
- Price action shows how the market is reacting in real time.
Confluence on the chart
Atlas can display multiple independent data layers on the same chart. This makes it easier to see when several platform signals are appearing around a similar price area. For public documentation, confluence should be understood as product visibility. Atlas helps users observe where Skylit data overlaps with chart levels. Academy content covers how users may apply that context in practice.Understanding expirations in Atlas
In Heatseeker, gamma exposure is organized by expiration. Each column on the heatmap represents a different contract expiration, such as the current expiration, next week, two weeks out, or later periods.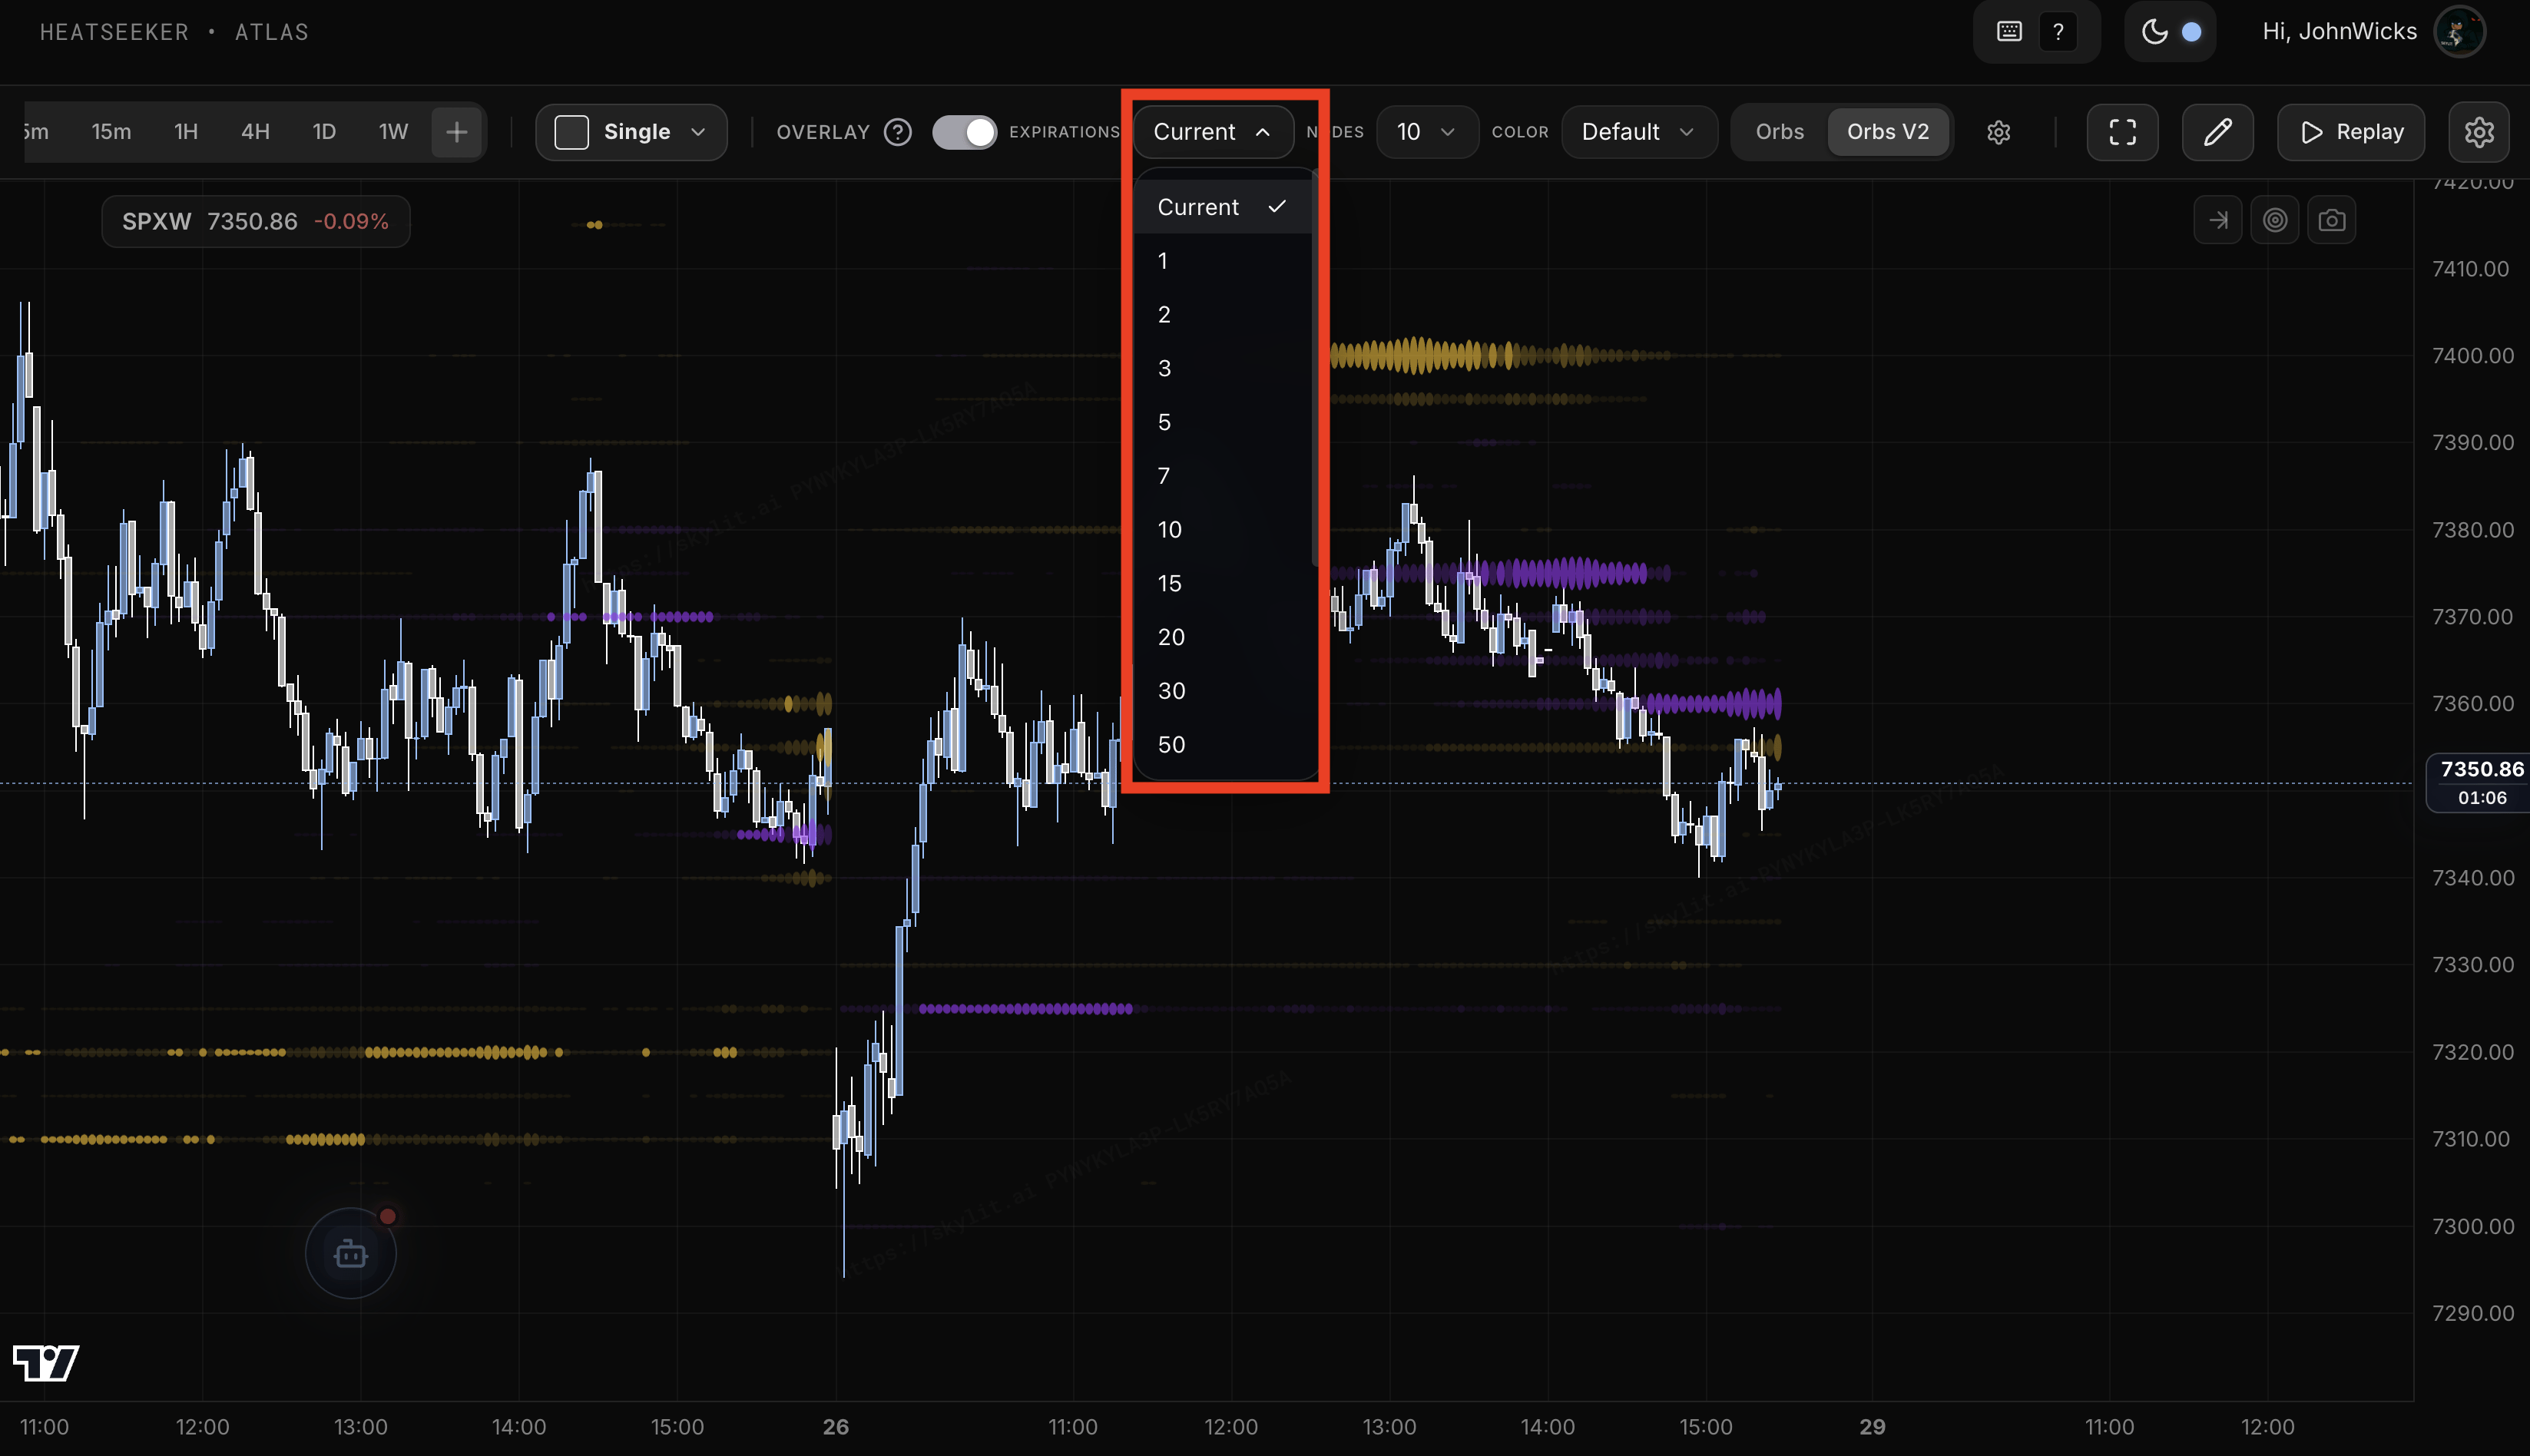
Why expiration selection matters
The same strike can look different depending on the expiration selected. A major node several expirations out may not be a major node for the current expiration.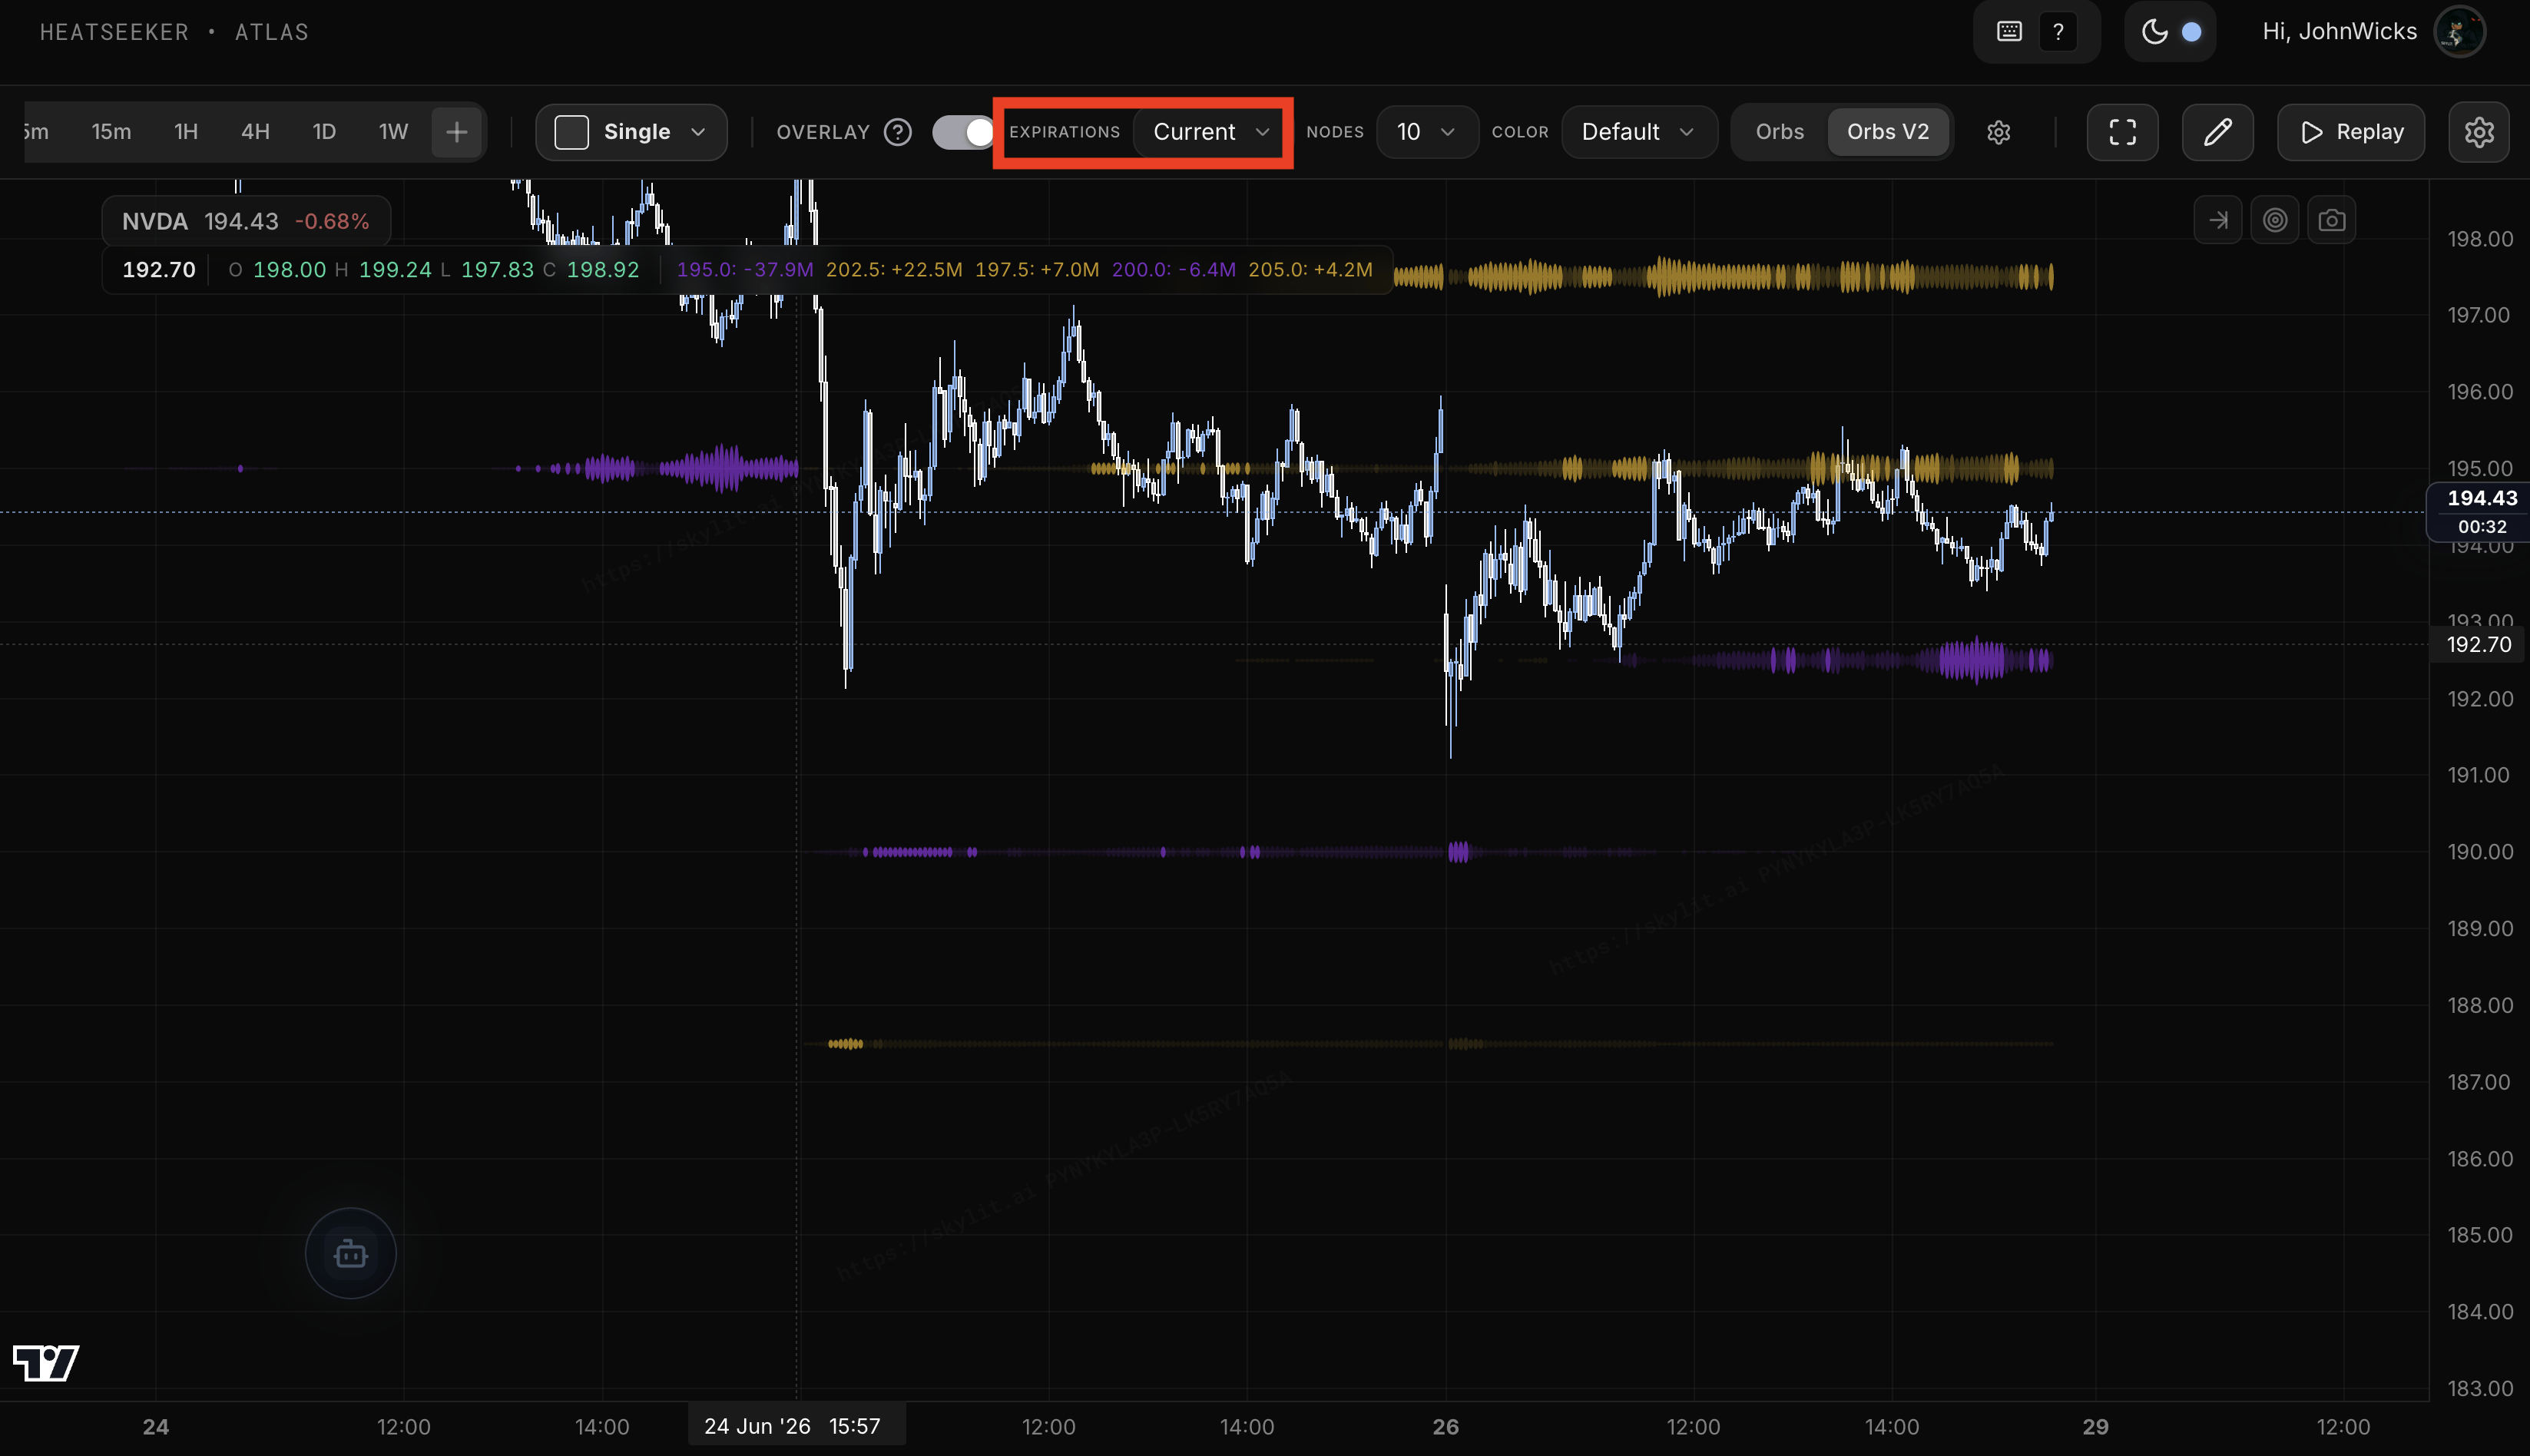
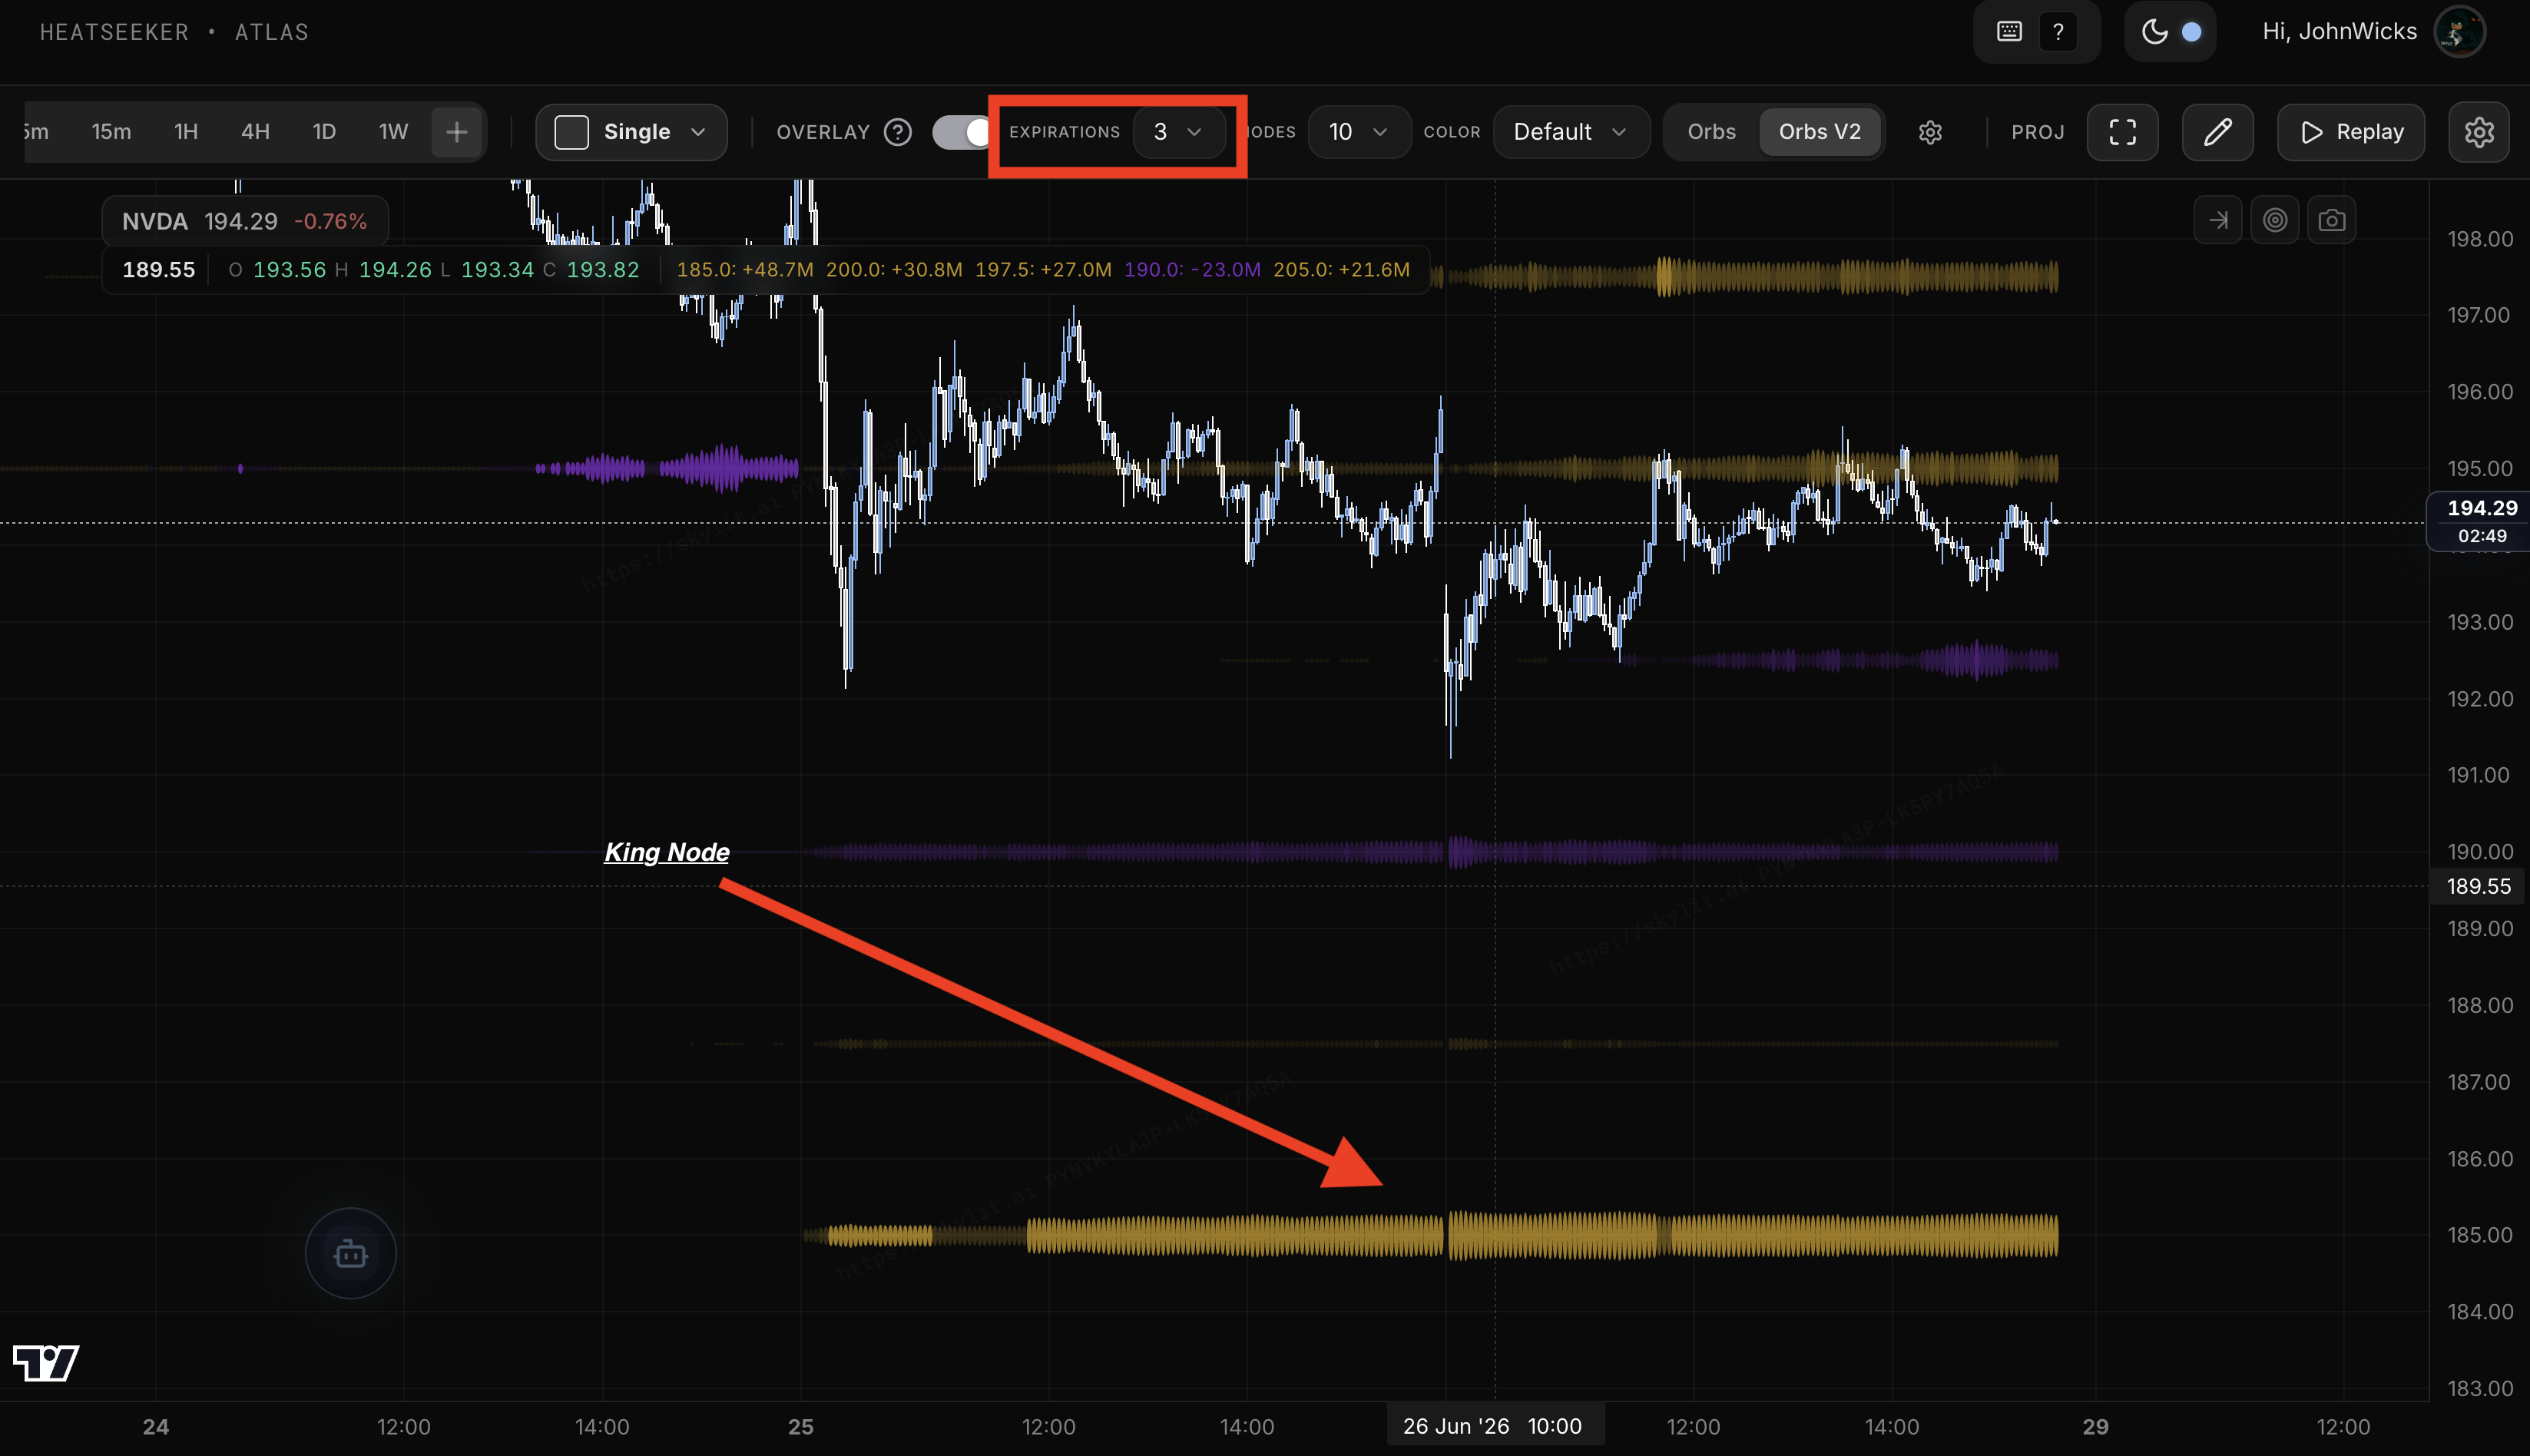
Common expiration concepts
Orbs overview
Orbs are visual chart overlays that represent Heatseeker node data inside Atlas. They help users see important levels from the heatmap directly on the chart. Atlas currently includes three Orb-related display modes:- Orbs Classic
- Orbs V2
- Derived Orbs, designed for futures-related overlays
Orbs Classic
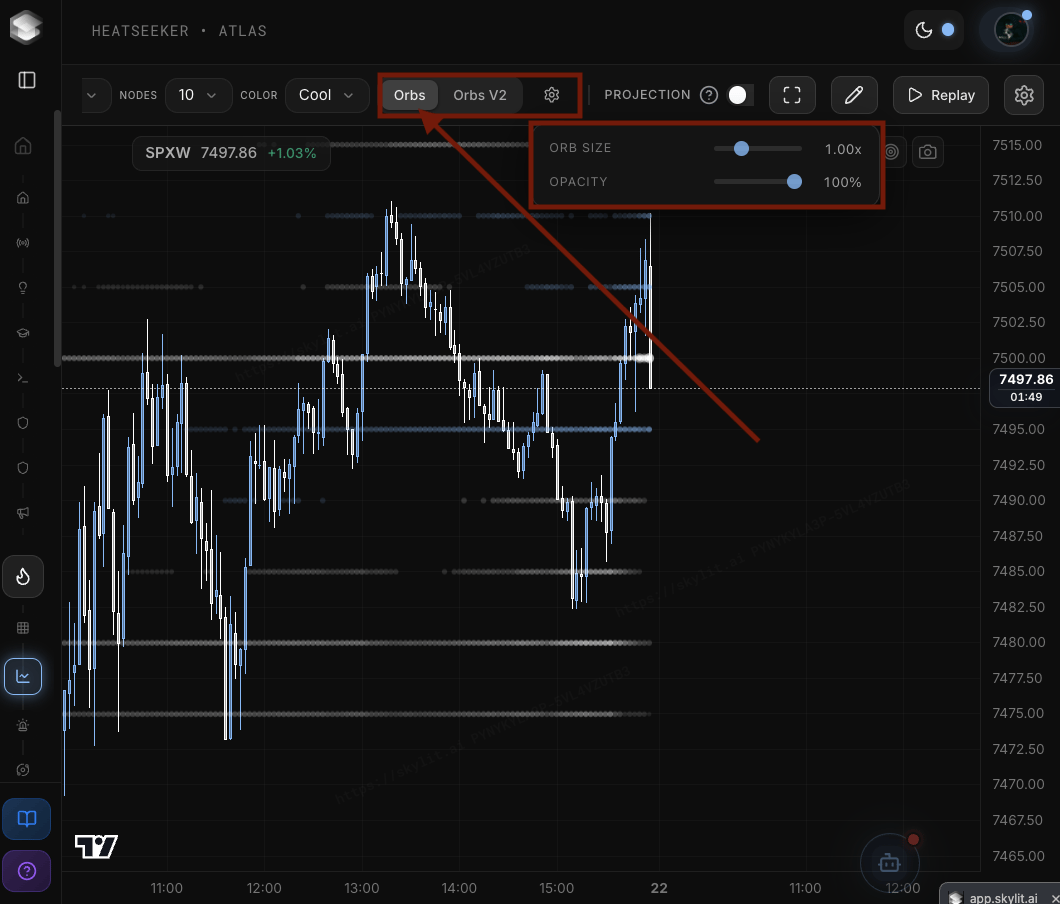
Orbs Classic provides a simpler visual design for displaying node strength.- Brighter or more intense colors indicate higher-value nodes.
- Duller colors indicate smaller or less intense nodes.
- Opacity adjusts the maximum brightness or intensity of the Orbs.
- Orb size controls how large or small the Orbs appear on the chart.
Orbs V2 settings
Orbs V2 gives users more control over how Heatseeker nodes appear on the chart.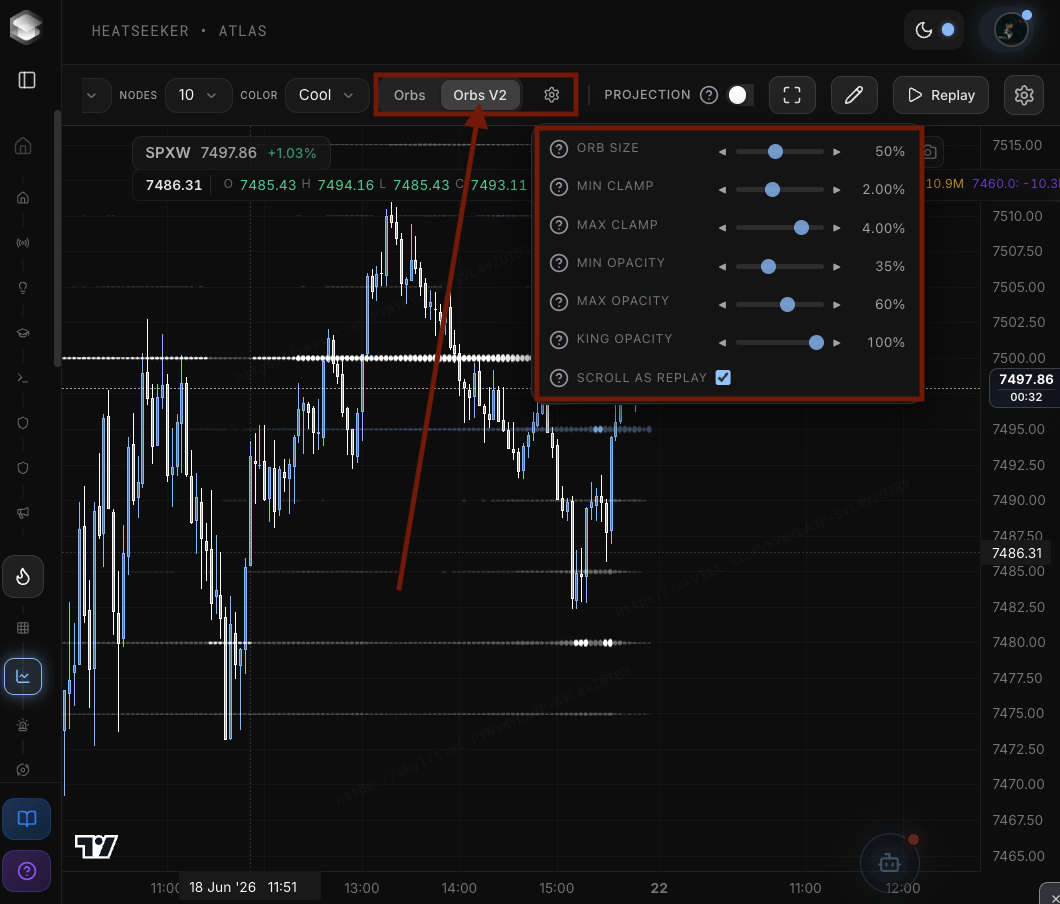
Scroll as Replay
When Scroll as Replay is enabled, Orbs V2 only uses information that was available at the selected historical point in time as the user scrolls backward through the chart. This helps users:- Review how dealer positioning developed throughout the session.
- Study historical chart action without future data influencing the visualization.
- Create a more realistic replay experience when reviewing prior sessions.
Derived Orbs
Some charts inside Atlas use derived exposure. This means the chart can borrow GEX or VEX levels from a related product.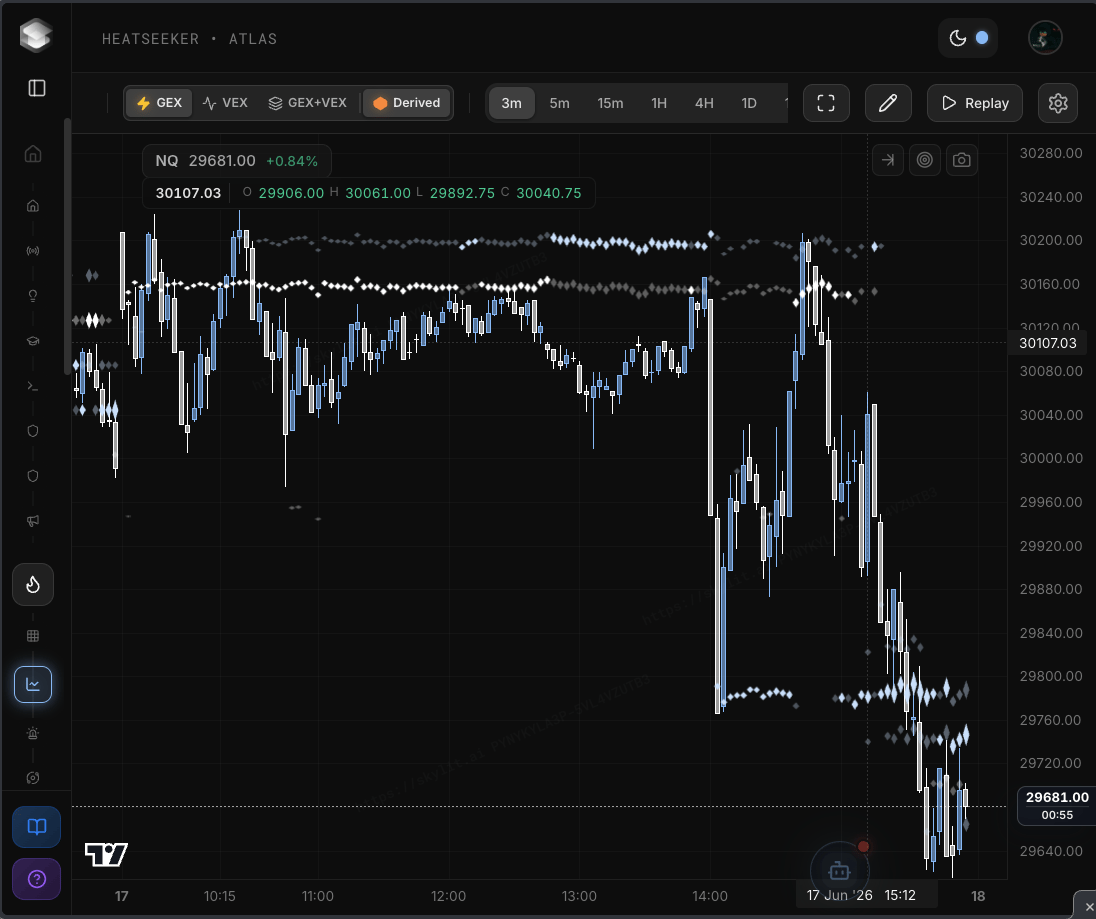
Derived Orbs allow users to see important dealer-positioning levels from the options market directly on futures or related instruments.
Understanding the wiggle
Because ES, NQ, SPX, SPY, SPXW, and QQQ do not always move perfectly together, borrowed levels may shift slightly as the session develops. This small movement is referred to as the wiggle. The wiggle does not mean the data is wrong. It means Atlas is adjusting borrowed levels so they remain aligned with live price movement instead of forcing them to stay frozen in one place. What users should know:- Derived levels may move slightly minute to minute. This is expected.
- Atlas adjusts derived levels to keep them synced with the live market.
- If a derived level briefly disappears, the source data may have temporarily dropped. Atlas may hide the level rather than display it in the wrong place.
Public Docs explain what derived levels are and why they may move. Atlas Academy covers applied walkthroughs for using these views in context.
Chart tools
Atlas includes additional chart tools that help users keep related context visible without leaving the chart workspace. These tools are designed to make the chart more informative while keeping the core price view in focus.Projections (Beta)
Projections are a beta Atlas feature that helps users visualize potential forward price-gravity zones directly on the chart.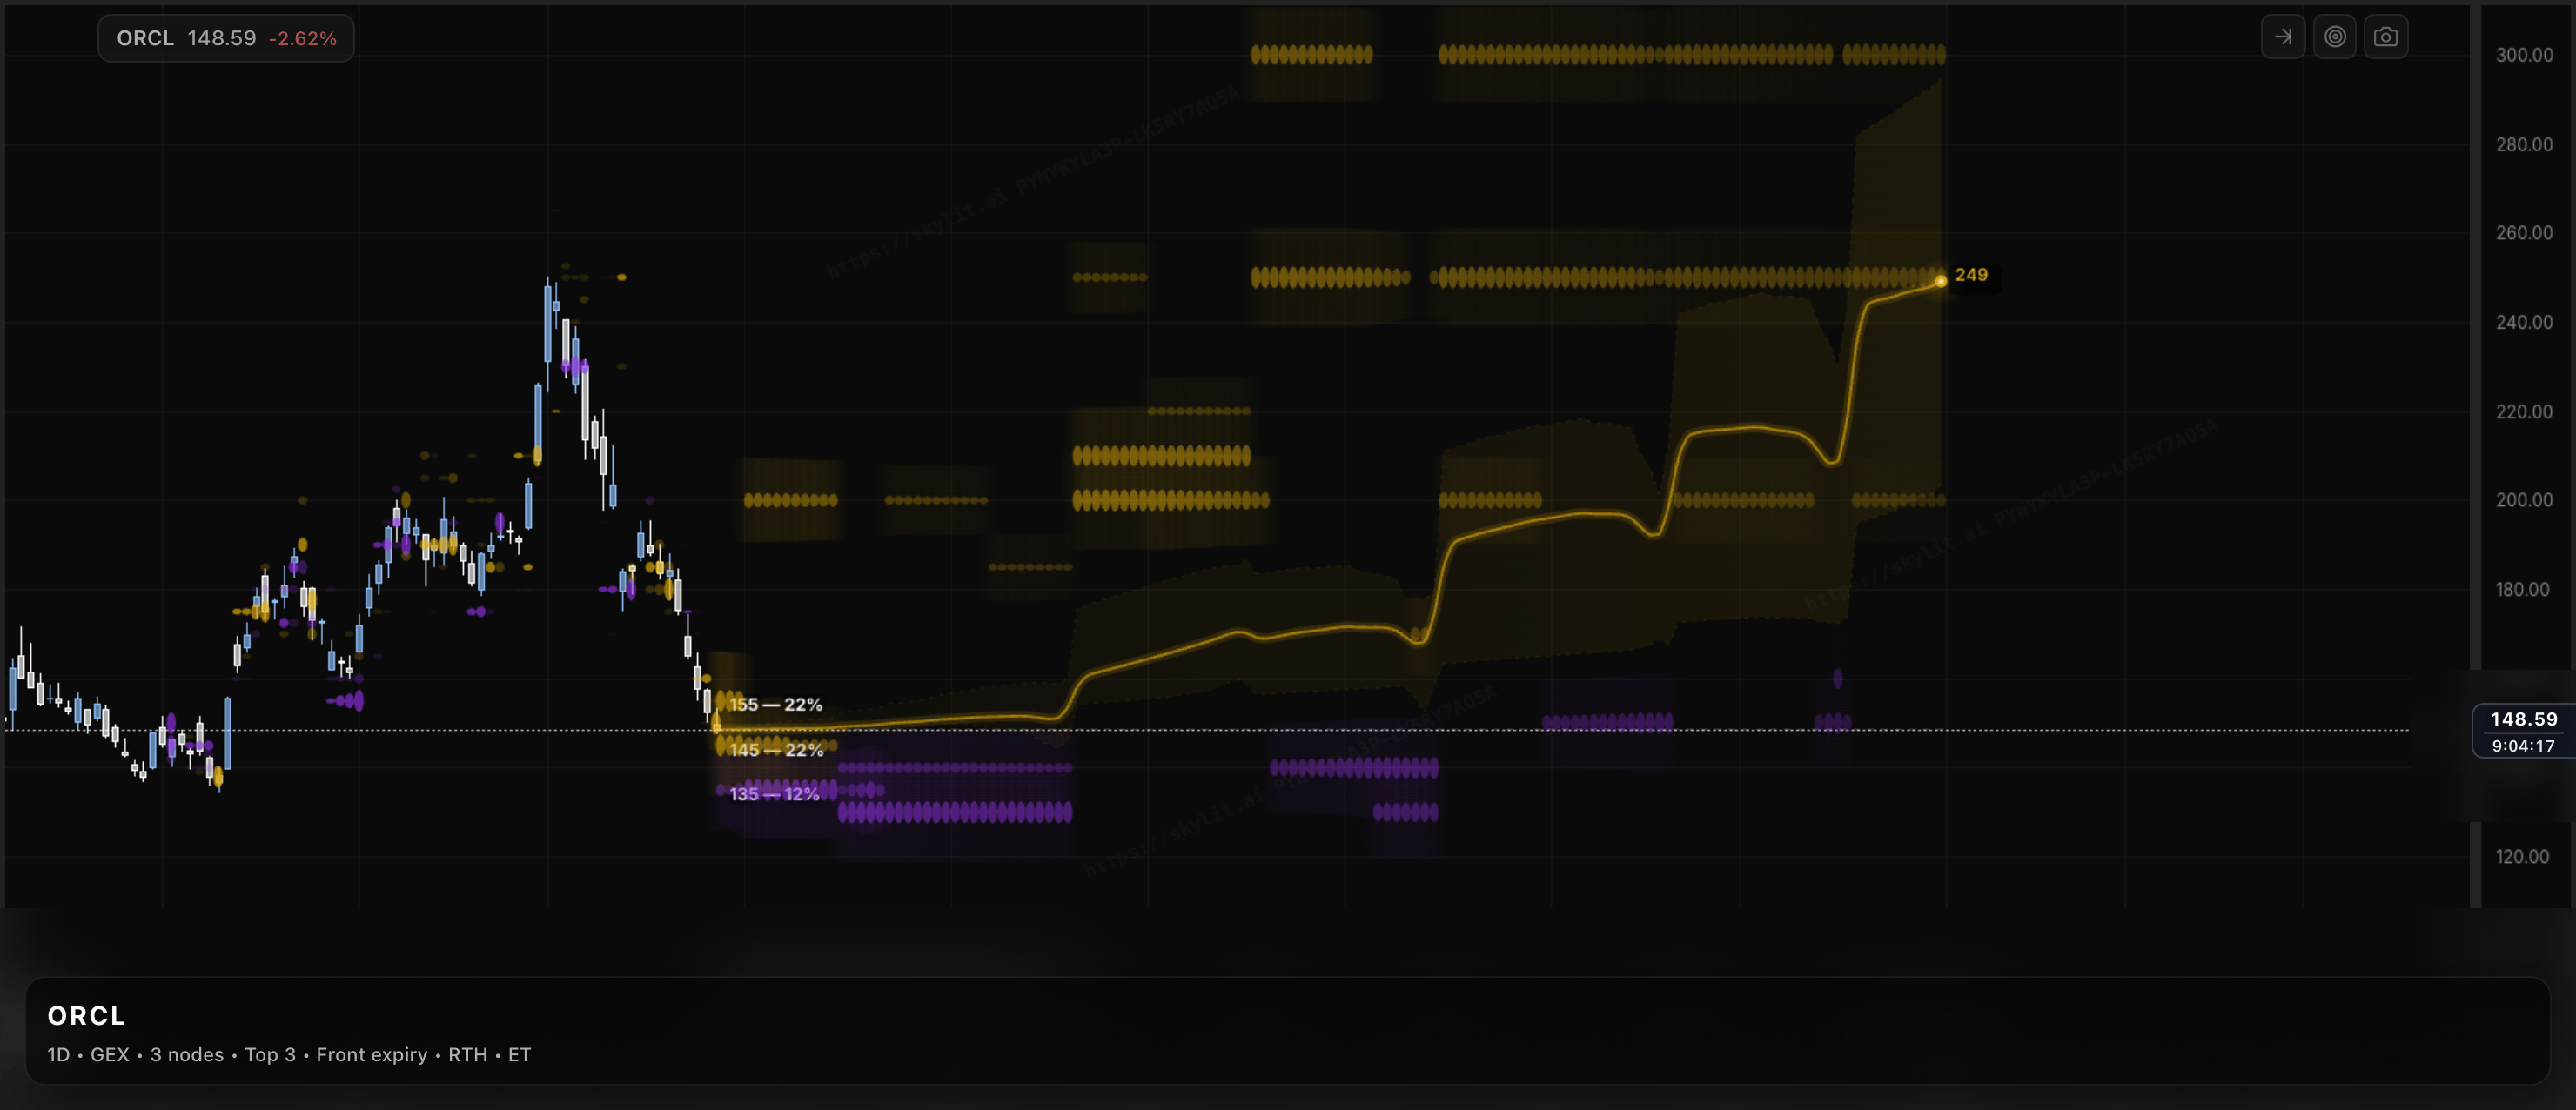
- A projected forward range on the chart.
- Possible upper and lower gravity zones.
- Estimated percentage levels around the current price area.
- A visual path for how price gravity may develop over the selected window.
Heatmap sidecar
The Heatmap sidecar brings Heatseeker-style positioning data directly beside the Atlas chart. This allows users to keep dealer-positioning context visible while reviewing price action. The sidecar can show strike levels, expiration columns, exposure values, high-value nodes, and current price location relative to nearby levels. Users can adjust the sidecar from the filter control. Common filters include the number of expirations shown, the number of nodes shown, the selected exposure type, and current versus expanded expiration views.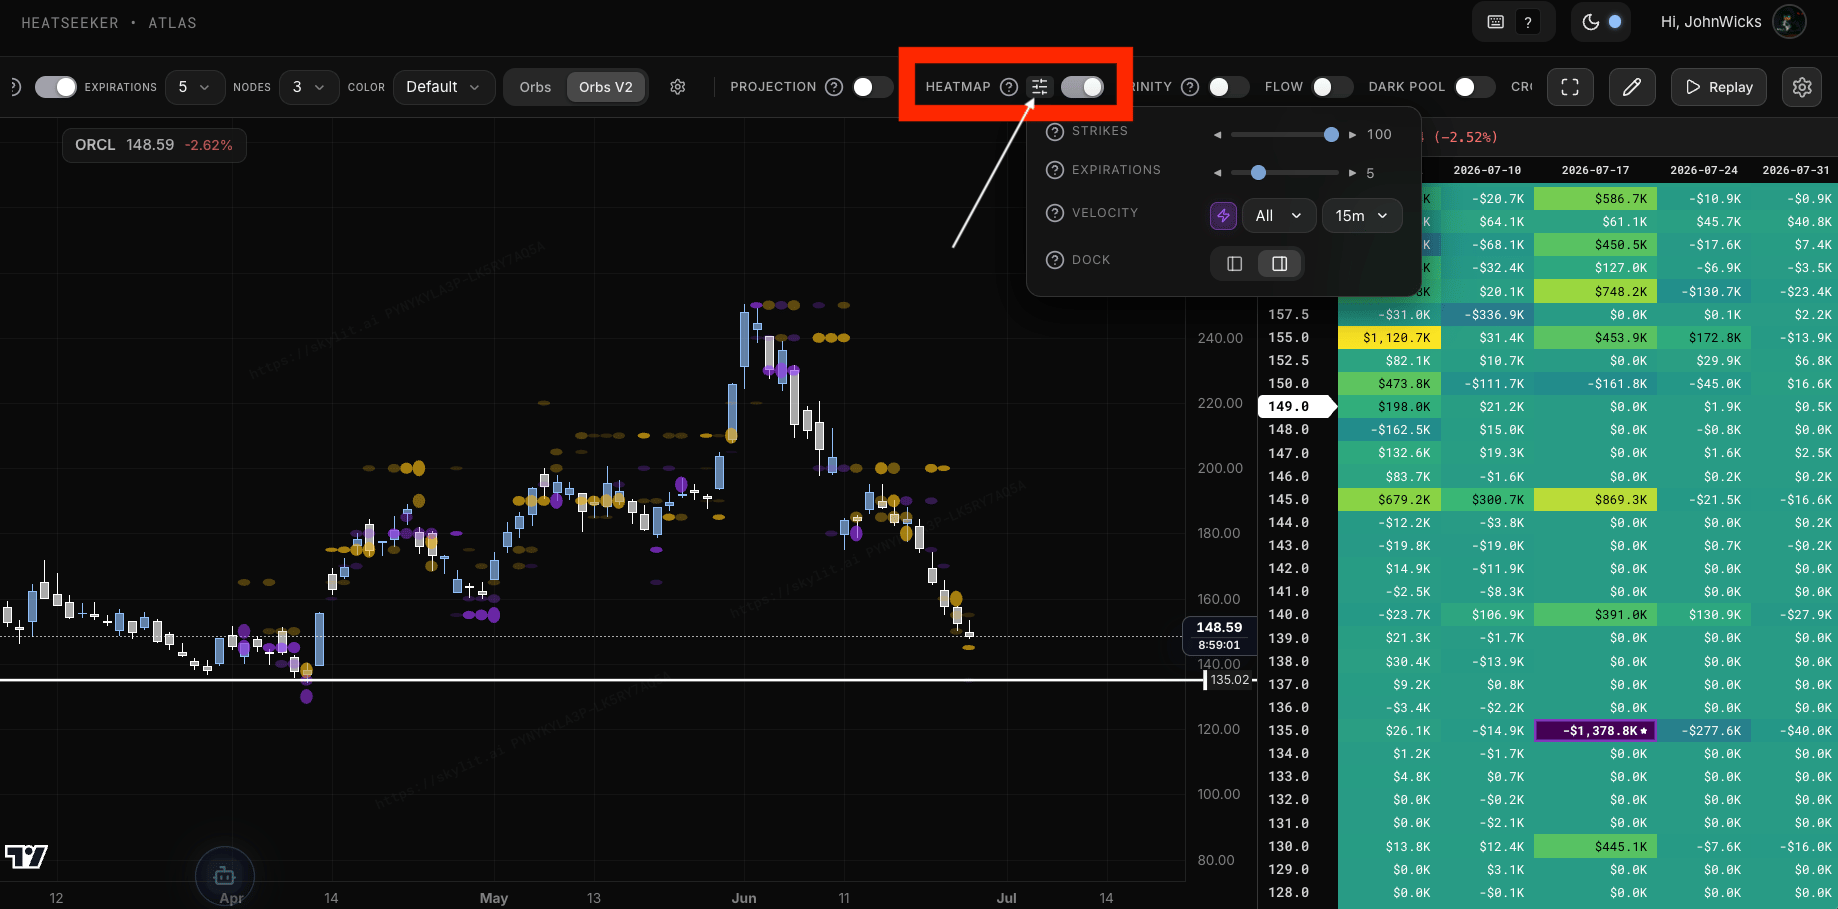
Trinity sidecar
Trinity extends the heatmap sidecar by showing related market heatmaps together in one view. Instead of reviewing each product separately, users can use Trinity to see broader cross-market positioning context from the Atlas workspace. Trinity may include related products such as SPX, SPY, and QQQ.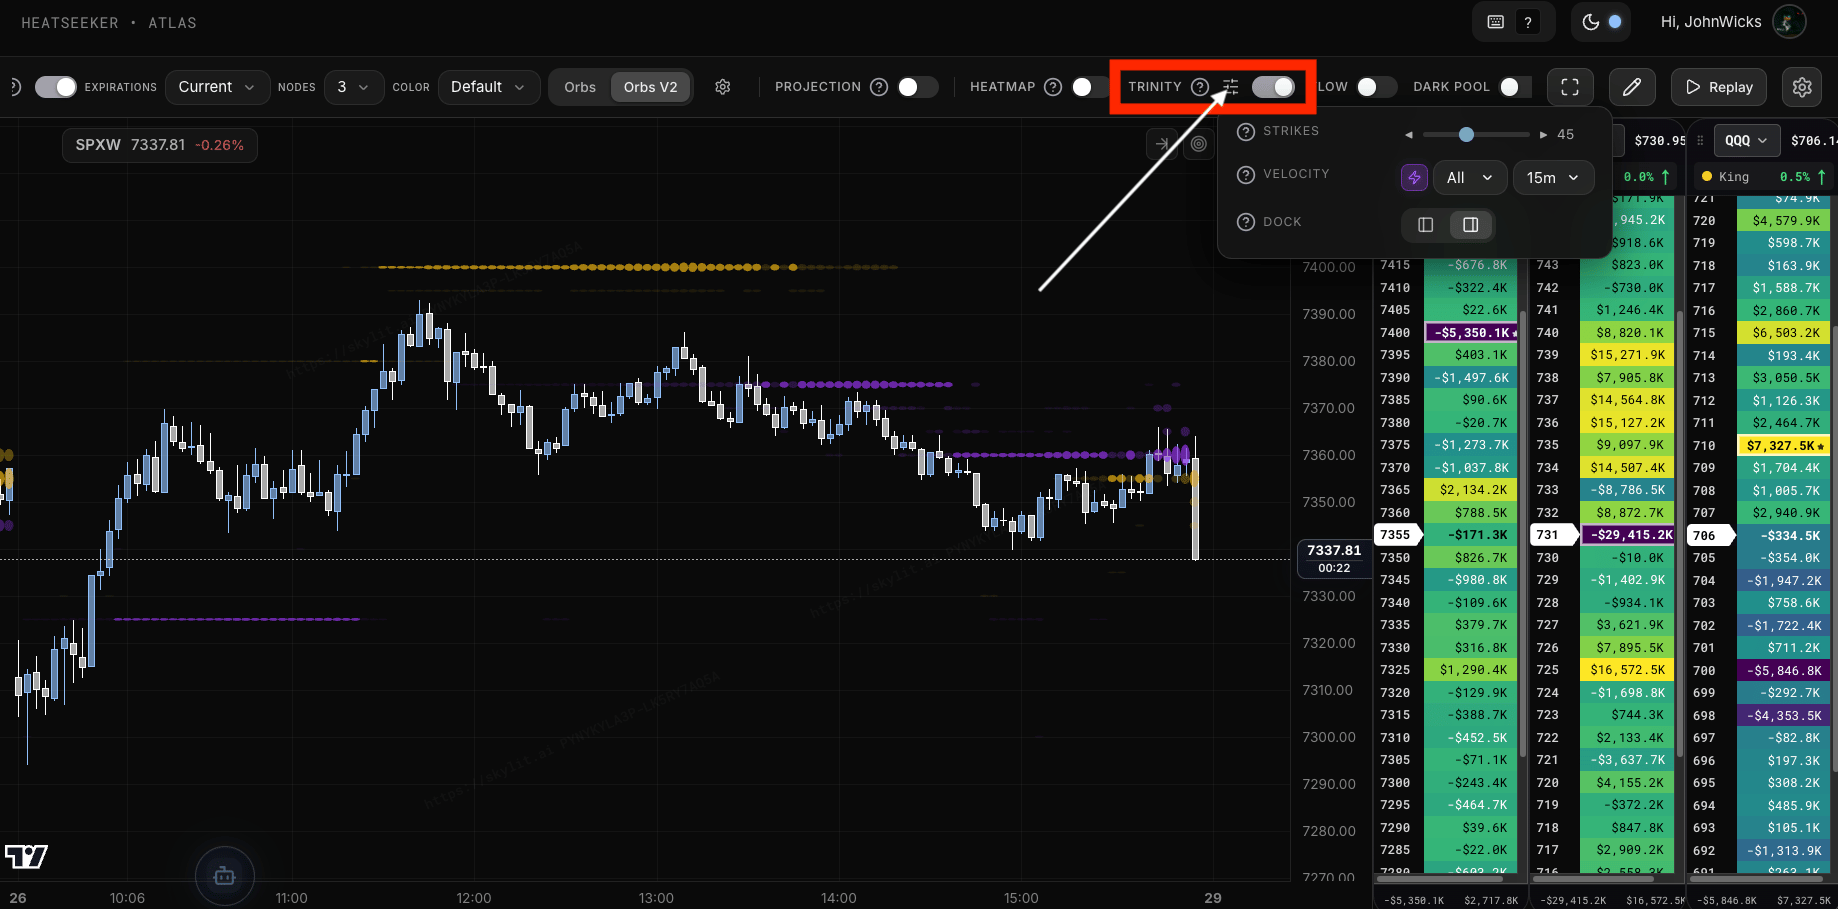
Public Docs explain what Trinity displays and how it fits into the Atlas workspace. Deeper interpretation and trading application belongs in Academy.
Flowseeker in Atlas
Atlas can display Flowseeker activity directly on the chart. When the Flow toggle is enabled, flow activity appears beneath the price chart so users can compare options-flow activity with chart movement. Users can click a flow bar to open more detail for the selected time range.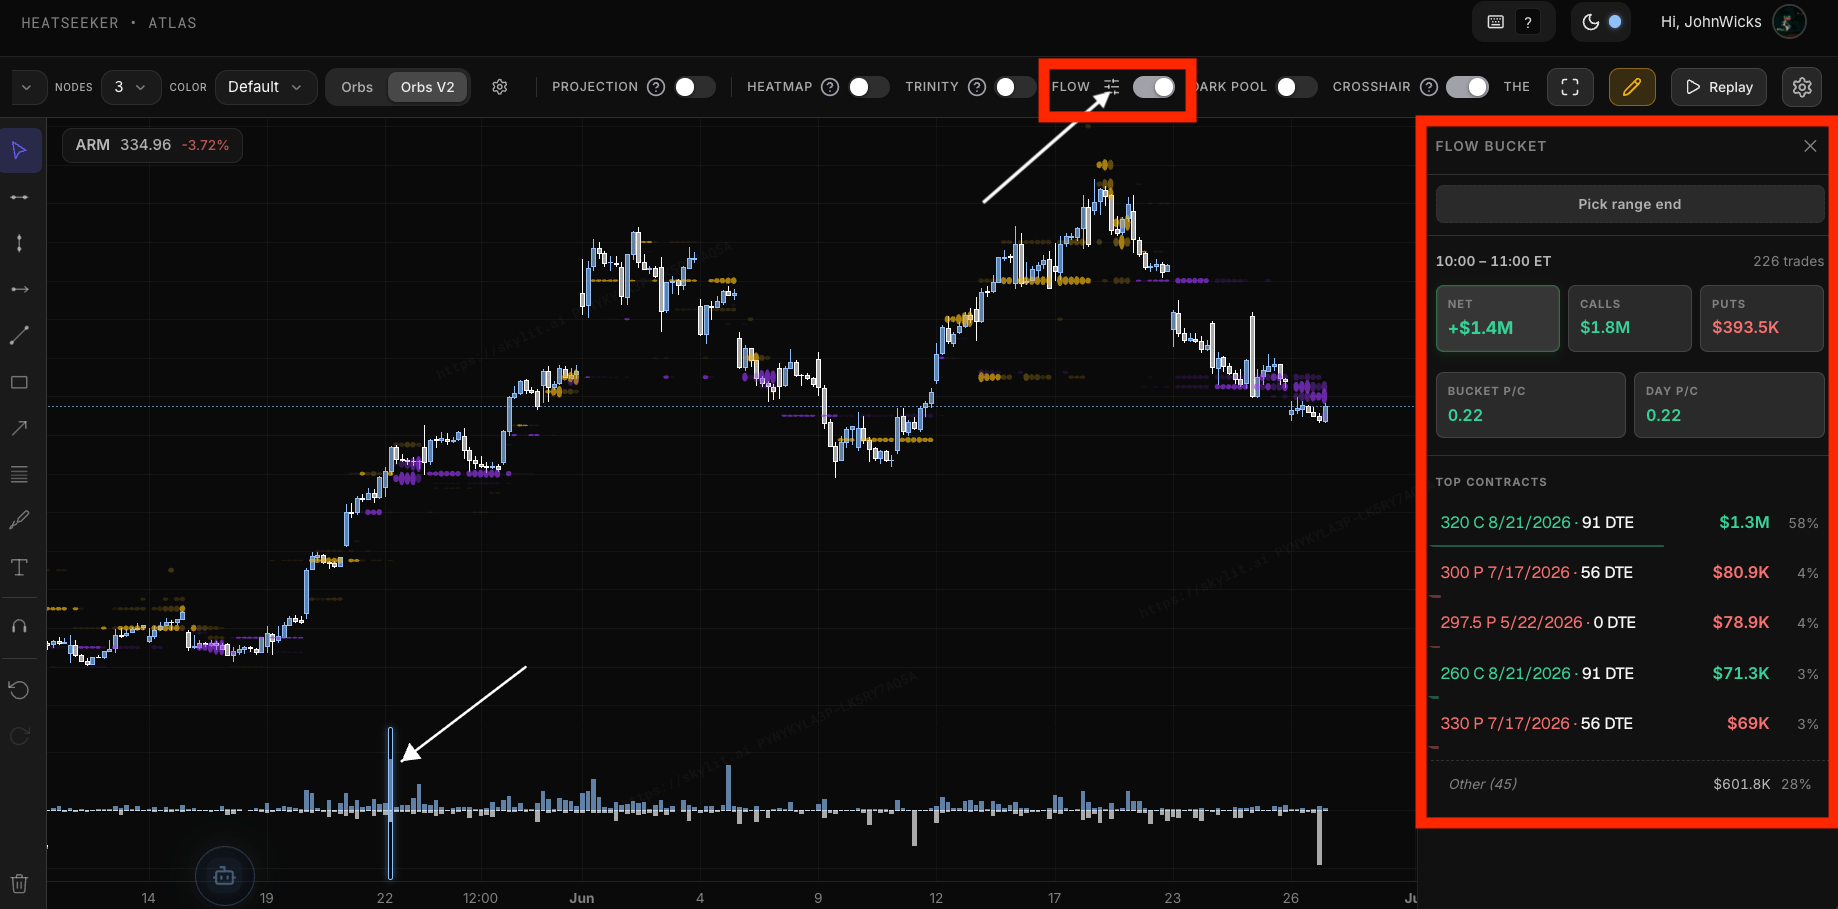
Flow Bucket
The Flow Bucket shows detailed Flowseeker data for a selected time window. After clicking a flow bar, Atlas opens a bucket view with summary metrics and contract-level detail. Depending on the selected window, the Flow Bucket may include:- Selected time range.
- Number of trades.
- Net flow.
- Calls and puts.
- Bucket put/call ratio.
- Day put/call ratio.
- Top contracts.
- Contract expiration and DTE.
- Contract premium or notional value.
Dark Pool levels
Atlas can display Dark Pool levels directly on the chart. When enabled, Dark Pool levels may appear as horizontal levels with labels showing the associated price area and activity context. Users can toggle Dark Pool levels from the chart toolbar and configure them through the filter icon. This gives users another layer of market structure to compare against price action, Heatseeker nodes, Flowseeker activity, and other Atlas overlays.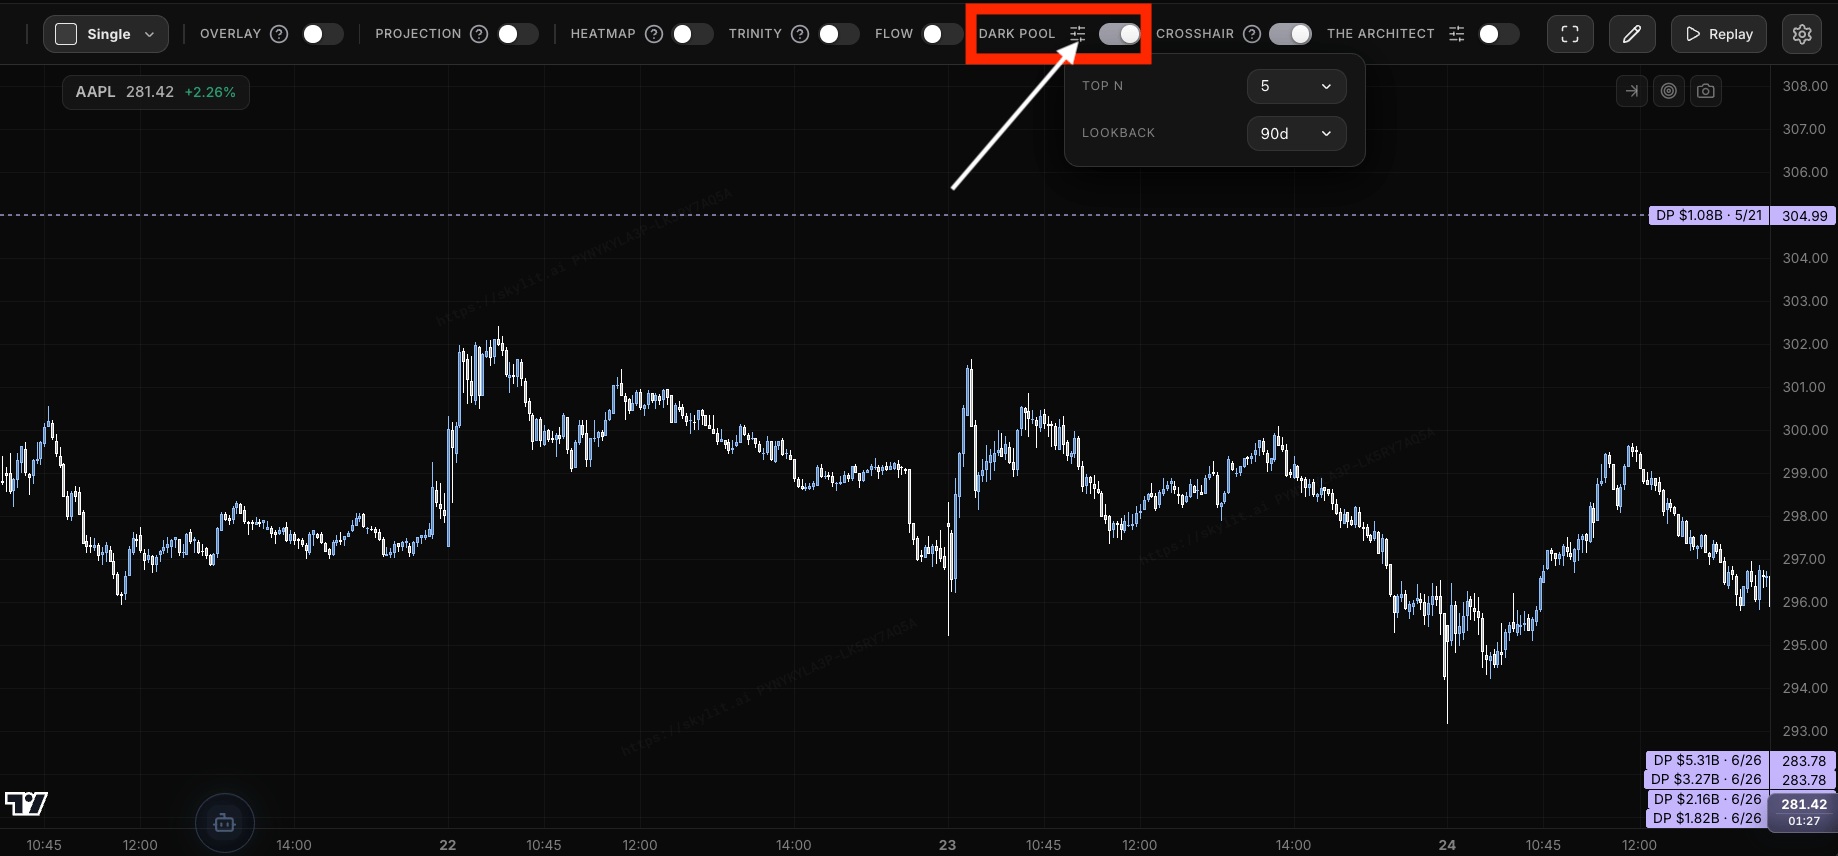
Replay and backtesting
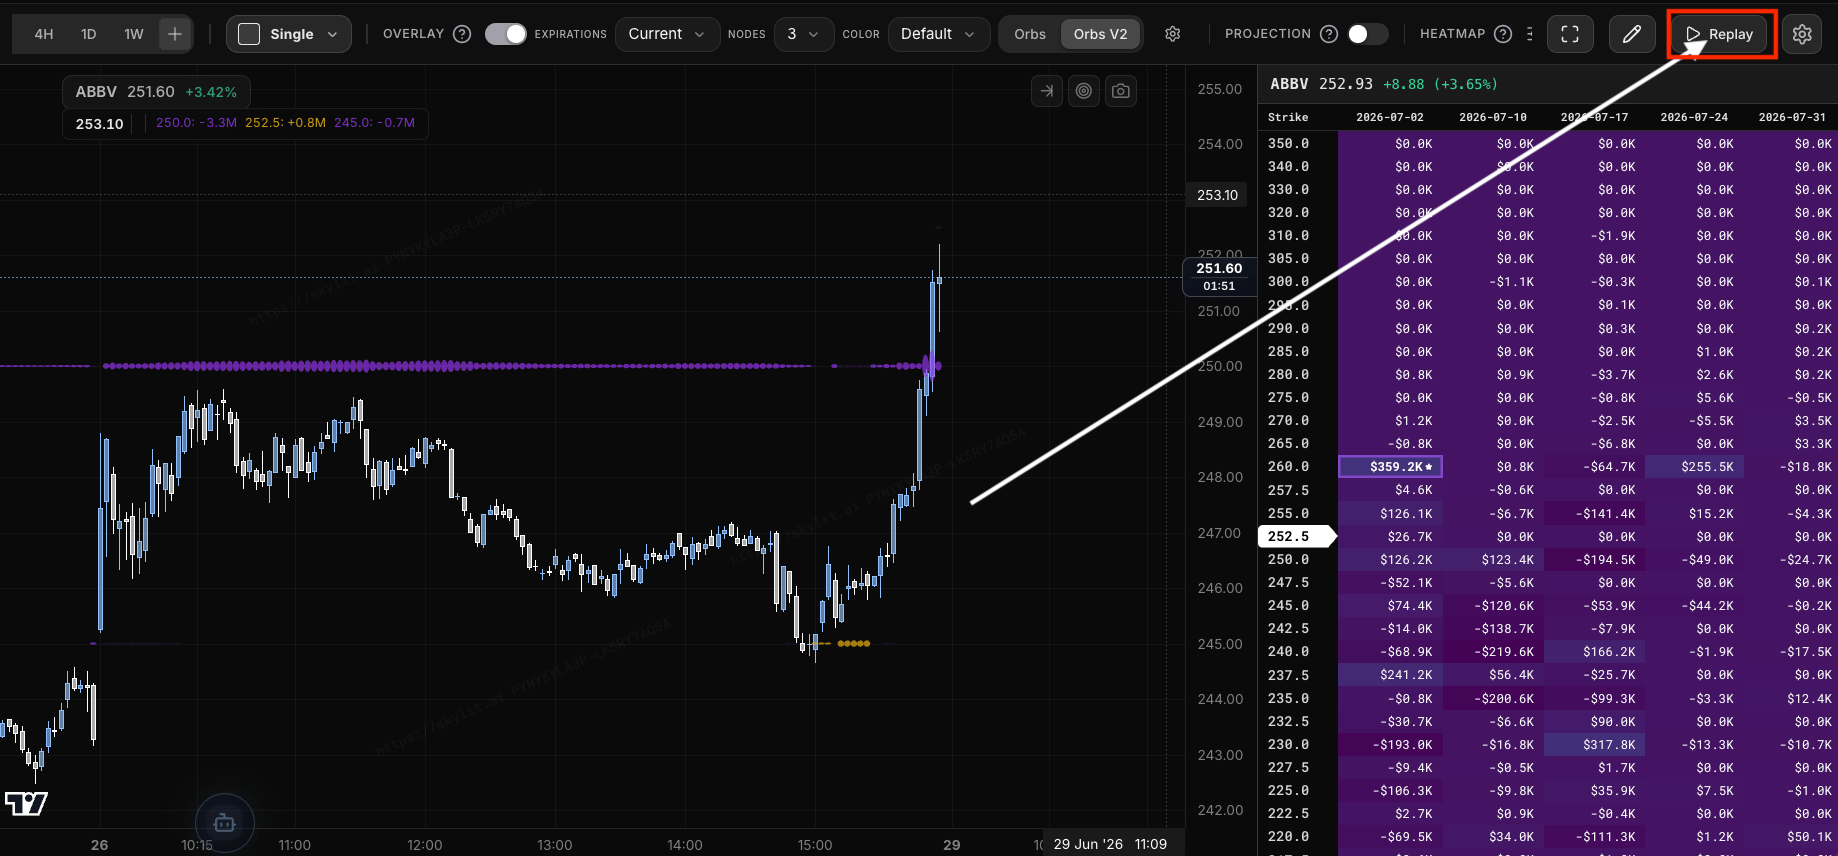
Atlas includes replay functionality for reviewing prior chart behavior. Replay allows users to move through historical chart action and study how Atlas data appeared at the time. This can help users review prior price action, node behavior, flow activity, and chart overlays as they existed during a selected period.Replay is designed for review and education. It should be used to understand how data changed over time, not to imply that future outcomes will repeat exactly.
Exposure views
Atlas allows users to switch between different exposure views. These views control which exposure layer is displayed on the chart.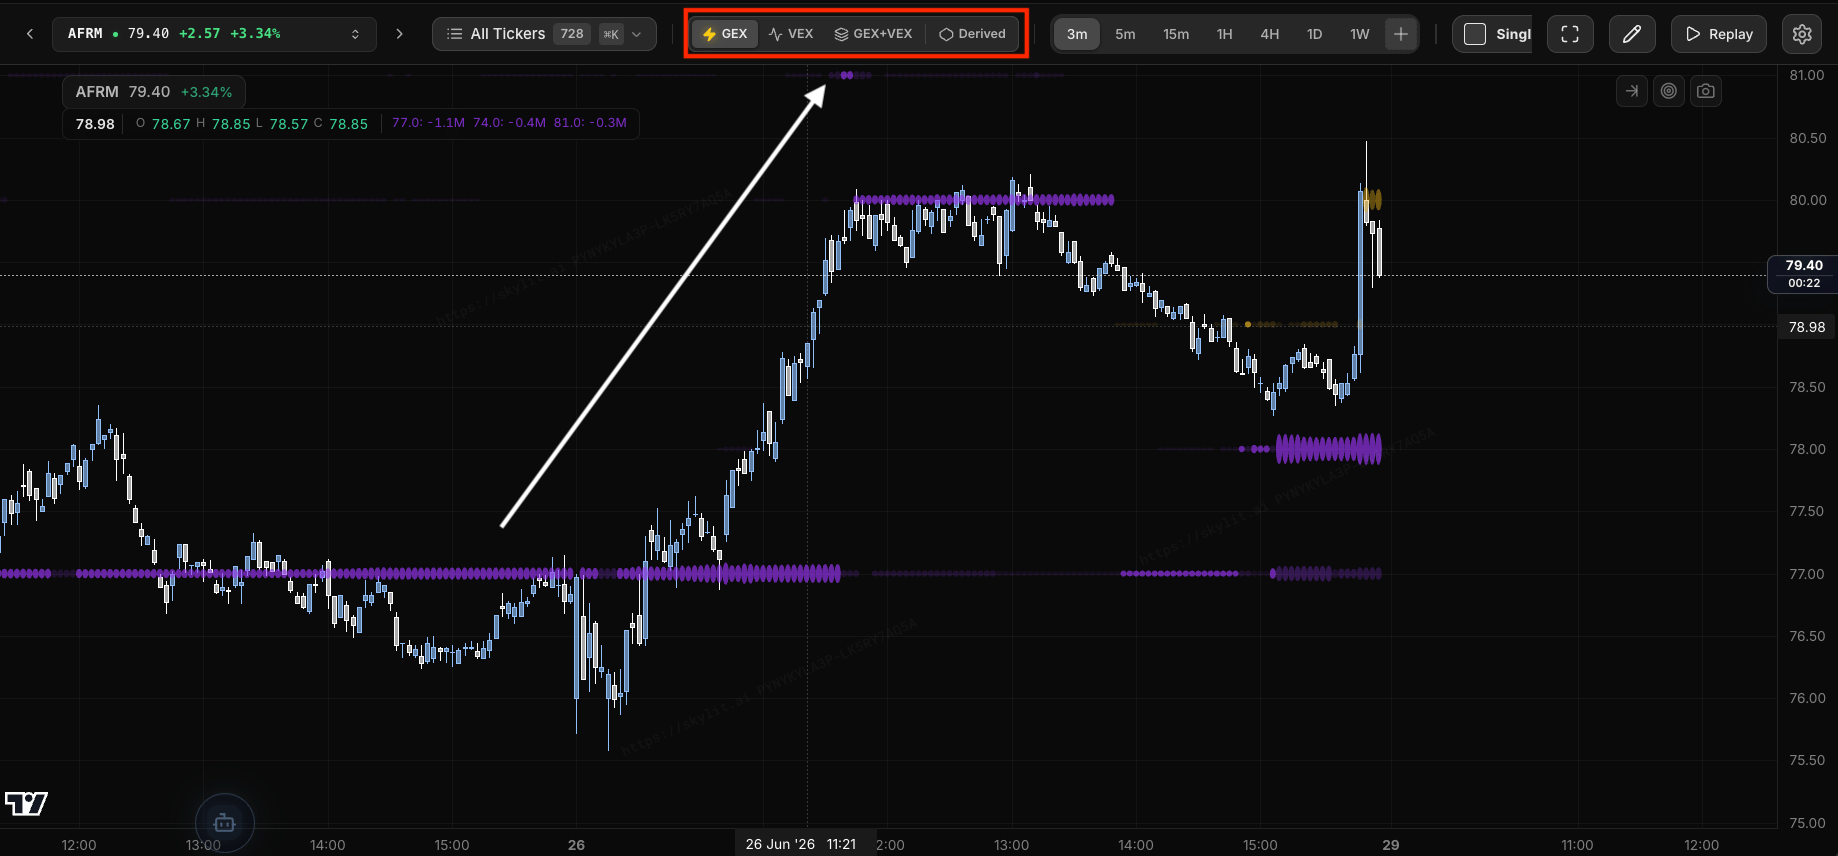
Changing the exposure view changes what layer of positioning data Atlas displays. It does not change the underlying price chart.
Chart layouts
Atlas supports named chart layouts so users can save complete chart workspaces and switch between them instantly. Each layout saves the full state of the Atlas workspace:- The pane arrangement (single chart, side-by-side, stacked, quad, and other multi-chart grids).
- Each pane’s symbol, timeframe, candle style, and overlay settings.
- Which Atlas layers are enabled — Orbs, Projections, Flow, Dark Pool levels, the Heatmap and Trinity side panels, and other toggles.
- Chart preferences such as timezone and session view.
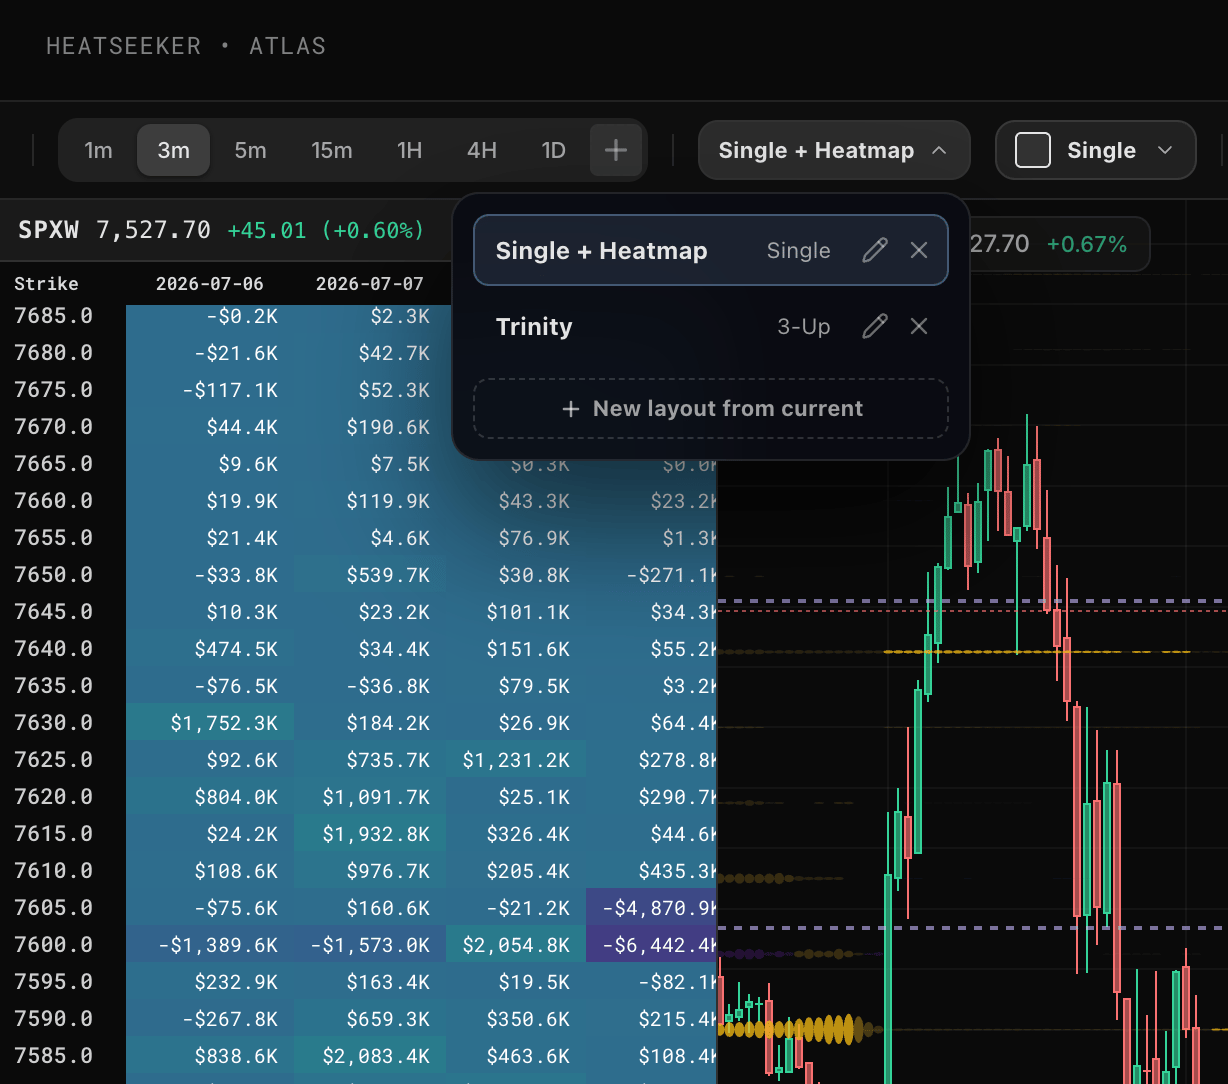
There is no Save button. Changes to the active layout — a symbol, a timeframe, a toggle, an arrangement — are saved automatically a moment after they happen.
Layouts are stored with the user’s Skylit account, so the same layouts are available across devices. A layout edited on one device updates on the others.
On mobile, layouts that use desktop-only arrangements are hidden from the switcher and remain available on desktop.